Hiring growth slowed in November among US companies, according to this morning’s update of the ADP Employment Report. Payrolls increased 179,000 last month, down from 225,000 in October. As expected, the annual pace of growth also ticked lower — just barely — although rounding the year-over-year change to one digit leaves the year-over-year trend at a healthy 2.0% for a second month – the fastest rise in over two years.
“Job growth is strong, but has likely peaked,” says Mark Zandi, chief economist of Moody’s Analytics, which co-produces the numbers with ADP (NASDAQ:ADP).
“This month’s report is free of significant weather effects and suggests slowing underlying job creation. With very tight labor markets, and record unfilled positions, businesses will have an increasingly tough time adding to payrolls.”
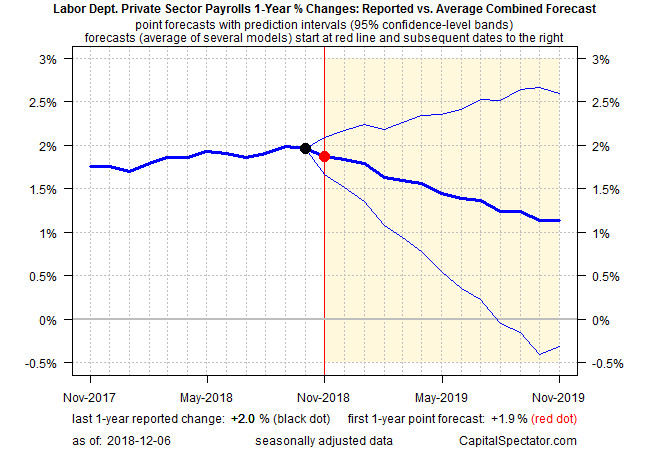
A fractionally softer year-over-year trend in private payrolls is expected in today’s estimate from the Labor Department (echoing the outlook for US GDP growth). The Capital Spectator’s point forecast for the one-year change in the government’s payrolls report for November (scheduled for release on Friday, Dec. 7) is 1.9%, down slightly from October’s 2.0% rise – a gain that matches September’s annual increase. The back-to-back advances in the last two updates mark the strongest year-over-year gains in two years, but that trend appears set to wilt, albeit fractionally in November.
Although the projected downshift in the annual trend for payrolls is expected to be measured, Zandi’s observation that employment growth has peaked appears set for confirmation in the published figures in the December update and beyond.

The projections are based on averaging forecasts from eight models, each using a different methodology and offer a different set of pros and cons. Numerous studies over the years advise that combining forecasts from different models generally improves the accuracy of the estimates relative to the projections from any one model. (For an example of the literature on the topic, see this summary.) Here’s a summary of the eight models used to generate the forecasts above. Seven of the models use univariate methods – analyzing the indicator under scrutiny in isolation – while the eighth model draws on multiple indicators. All the analytics are generated in R.
Exponential smoothing state space model: the average forecast is used from 100 simulations based on bootstrap aggregating via the forecasting package. The data set is the historical record for the target indicator.
Autoregressive integrated moving average model: the average forecast is used from 100 simulations based on bootstrap aggregating via the forecasting package. The data set is the historical record for the target indicator.
Neural network model: the average forecast is used from 100 simulations via the forecasting package. The data set is the historical record for the target indicator.
Naïve model: this forecast simply extracts the last data point and assumes that it will prevail for the next 12 months.
Cubic Spline model: a local linear forecasts using cubic smoothing splines via the forecasting package. The data set is the historical record for the target indicator.
Facebook’s Prophet forecasting tool. The data set is the historical record for the target indicator.
Theta method forecast model: the methodology is a simple exponential smoothing with drift via the forecasting package.
Vector autoregression model: this multivariate methodology (via the vars package) uses the following datasets:
- ADP estimate of private payrolls
- US Labor Dept estimate of private payrolls
- Personal consumption expenditures
- 10-year Treasury yield
- Effective Federal funds rate
- Housing starts
- Housing permits
- Retail sales (headline)
- Industrial production
- Consumer Price Index (headline)
- University of Michigan Consumer Sentiment Index
- Disposable personal income
- University of Michigan consumer inflation expectations
