Get 40% Off
🚨 Volatile Markets? Find Hidden Gems for Serious OutperformanceFind Stocks Now

Watch These Financial Instruments For Equity Weakness

Published 02/12/2018, 04:57 AM
Updated 07/09/2023, 06:31 AM

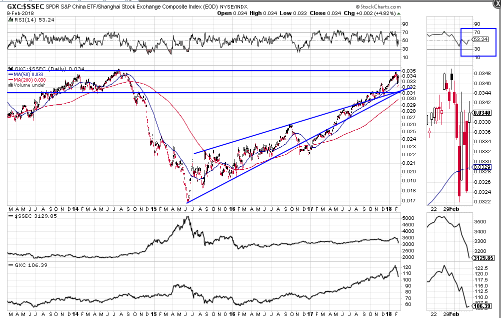
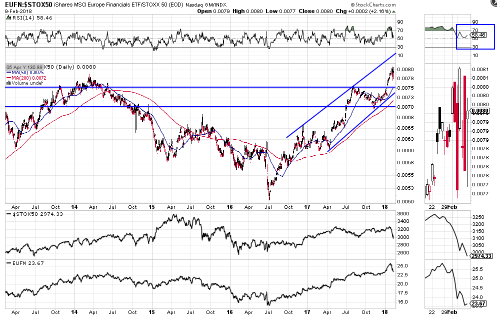
The following daily ratio charts show the performance of three Financial ETFs with their respective country/union's Major Index, namely, NYSE:XLF:SPX, NASDAQ:EUFN:STOXX50, and NYSE:GXC:SSEC.

Each of them has weakened compared with their counterpart index during the volatility spike that occurred in world markets over the past couple of weeks. These ratios had either reached or broken above some sort of resistance level and are now above near-term support.

If we see the RSI decline below the 50.00 level, this could be a warning signal that their indices may weaken more than is currently anticipated.
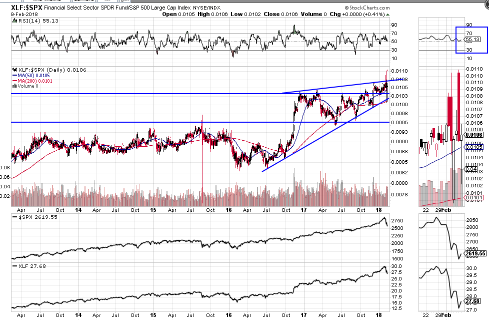
XLF-SPX Daily Chart
EUFN-STOX50
GXC-SSEC

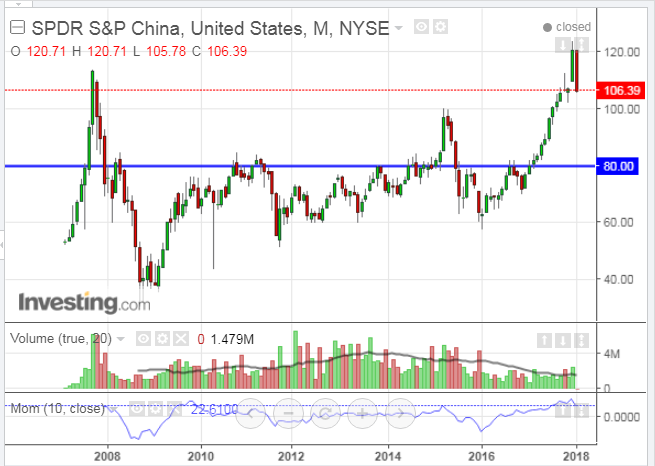
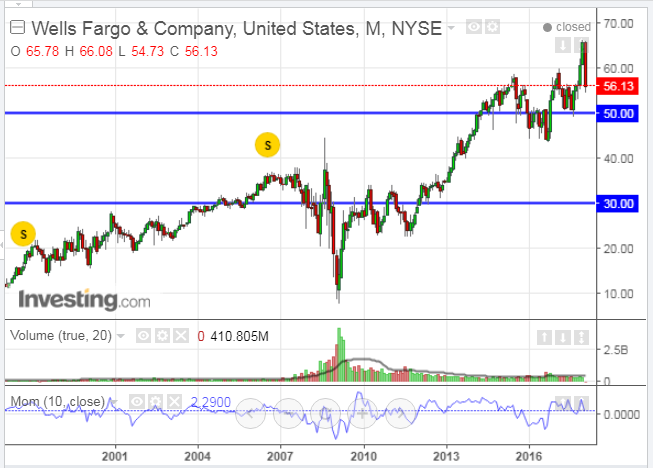
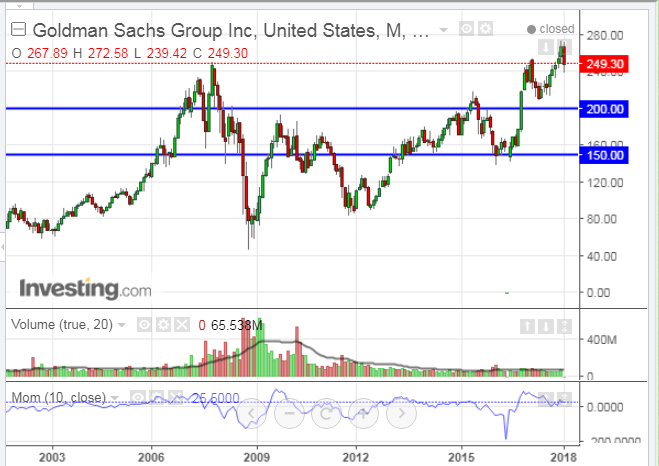
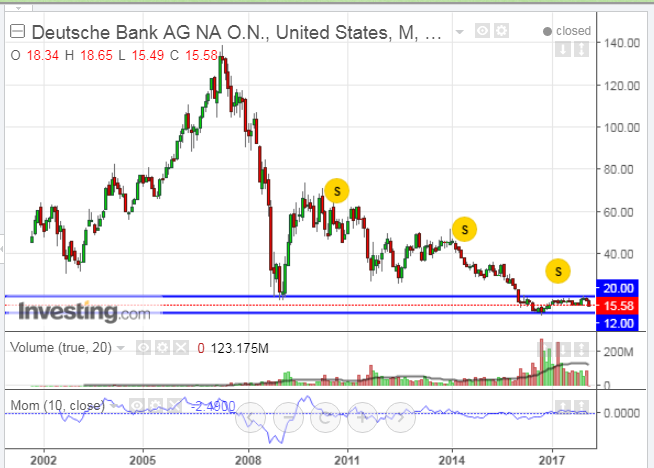
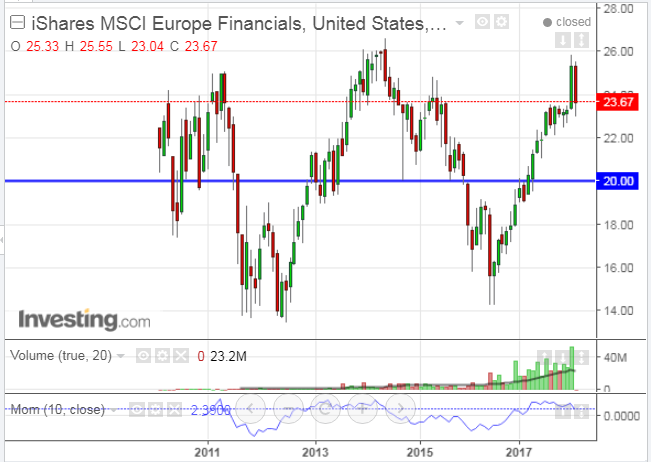
The following monthly charts of XLF, EUFN, GXC, Wells Fargo & Company (NYSE:WFC), Goldman Sachs Group Inc (NYSE:GS) and Deutsche Bank AG (DE:DBKGn) NA O.N. (NYSE:DB) all show that they had reached major resistance (either price or trendline) and have pulled back. Their respective support levels are shown, along with the momentum indicator.

With the exception of GXC, momentum on all of them had, either stalled, or had been declining on their latest price ascent...hinting of impending weakness. Momentum on EUFN and WFC is close to breaking below zero, and is below zero on DB. A drop and hold below zero on this timeframe could see an acceleration in selling in these instruments, as well as major world indices, in this current high-volatility environment.
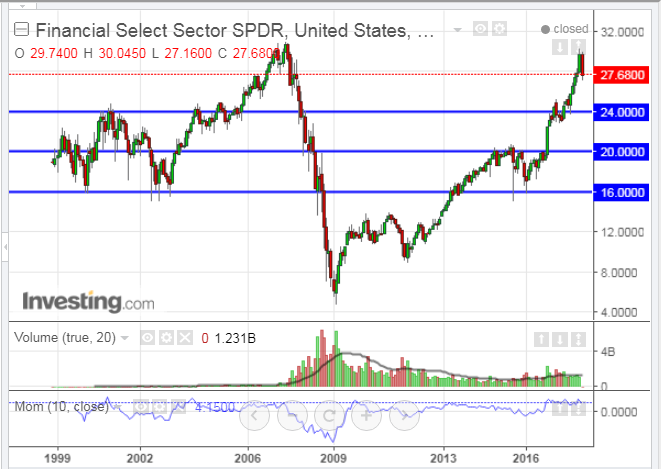
Financial Select Sector ETF Chart
iShares MSCI Europe ETF Chart
SPDR S&P China Monthly Chart
Wells Fargo & Company Monthly Chart
Gloldman Sachs Group Monthly Chart
Deutsche Bank Monthly Chart

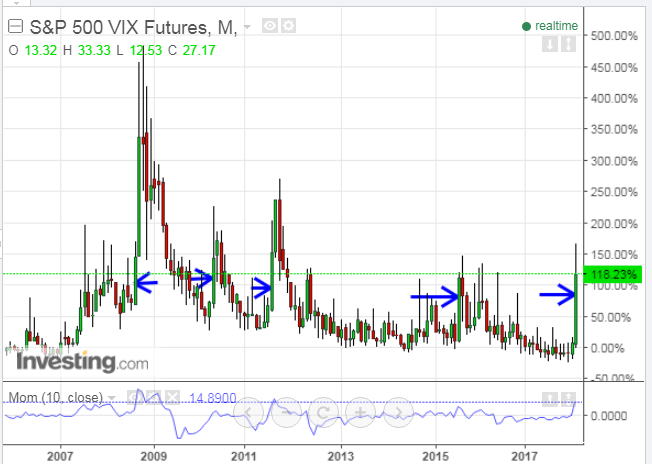
Finally, of interest is the trading range of February's candle on the following monthly (percentage) chart of the VIX.

As of last Friday's close, we're only seven trading days into February and already this month's candle range is larger than those of previous spikes (with the exception of those that began in October 2008 prior to the financial crisis), and its percentage-gained has exploded in those seven days. As well, momentum is rapidly rising on this timeframe. I think that this is signalling that the selling in the SPX has not yet finished.

3rd party Ad. Not an offer or recommendation by Investing.com. See disclosure here or remove ads .

So, keep an eye on the financial instruments mentioned above for clues on equity weakness.
S&P 500 VIX Futures Monthly Chart

Latest comments

Risk Disclosure: Trading in financial instruments and/or cryptocurrencies involves high risks including the risk of losing some, or all, of your investment amount, and may not be suitable for all investors. Prices of cryptocurrencies are extremely volatile and may be affected by external factors such as financial, regulatory or political events. Trading on margin increases the financial risks.
Before deciding to trade in financial instrument or cryptocurrencies you should be fully informed of the risks and costs associated with trading the financial markets, carefully consider your investment objectives, level of experience, and risk appetite, and seek professional advice where needed.
Fusion Media would like to remind you that the data contained in this website is not necessarily real-time nor accurate. The data and prices on the website are not necessarily provided by any market or exchange, but may be provided by market makers, and so prices may not be accurate and may differ from the actual price at any given market, meaning prices are indicative and not appropriate for trading purposes. Fusion Media and any provider of the data contained in this website will not accept liability for any loss or damage as a result of your trading, or your reliance on the information contained within this website.
It is prohibited to use, store, reproduce, display, modify, transmit or distribute the data contained in this website without the explicit prior written permission of Fusion Media and/or the data provider. All intellectual property rights are reserved by the providers and/or the exchange providing the data contained in this website.
Fusion Media may be compensated by the advertisers that appear on the website, based on your interaction with the advertisements or advertisers.
© 2007-2024 - Fusion Media Limited. All Rights Reserved.