The housing market continues to grow. New home sales increased 6.1% M/M and 12.8% Y/Y. While existing home sales declined 3.7% M/M they rose 12.8% Y/Y. The following chart places these figures into a longer-term context:
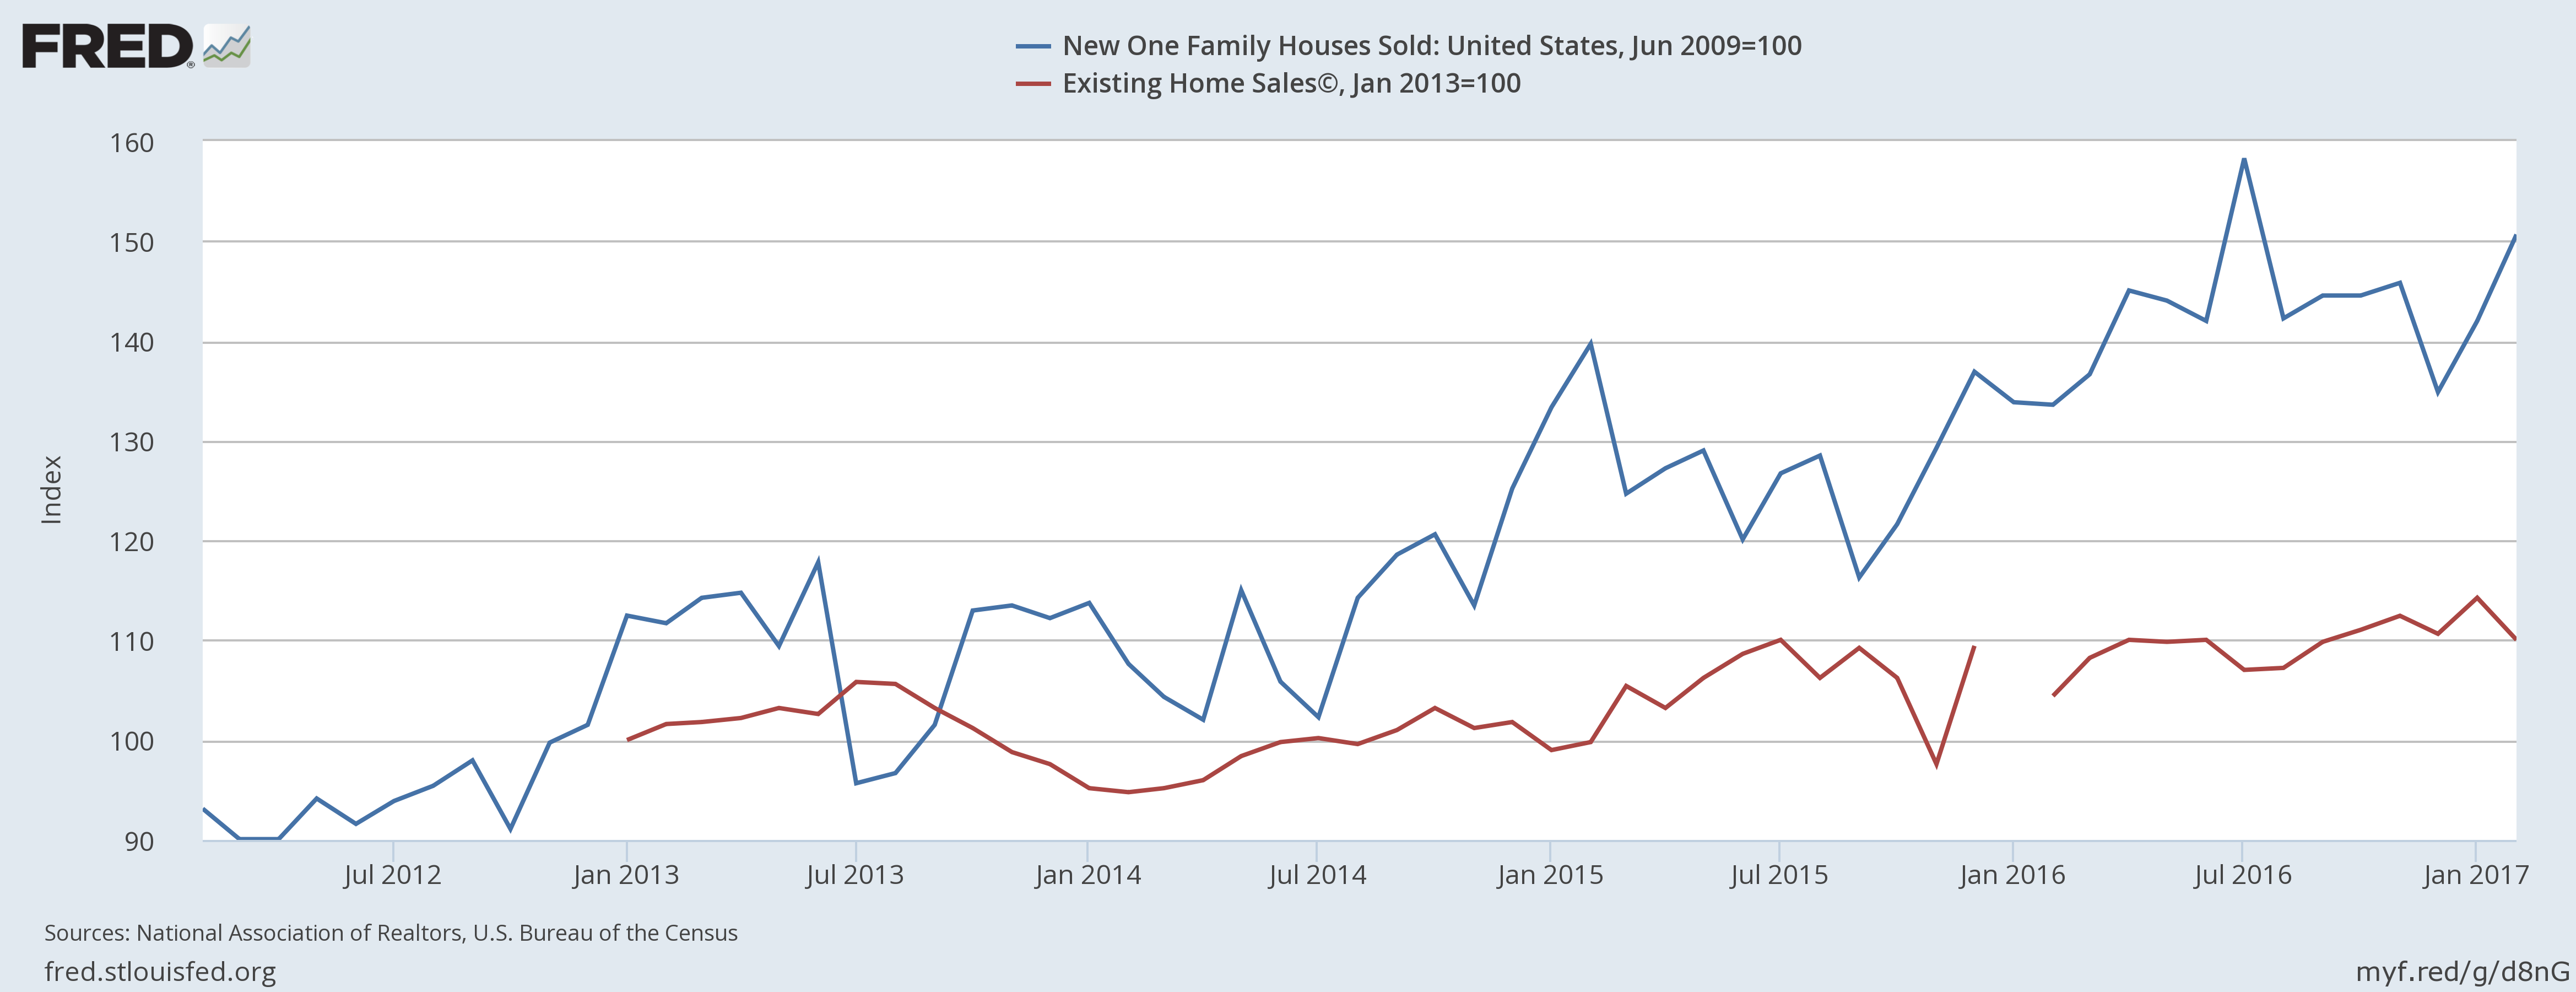
The graph converts figures to base100, making the end of the recession 100. New home sales (in blue) have consistently risen since mid-2013. Existing home sales rose modestly between January and July 2014 but have moved sideways since. Inventory levels explain both market’s sales figures:
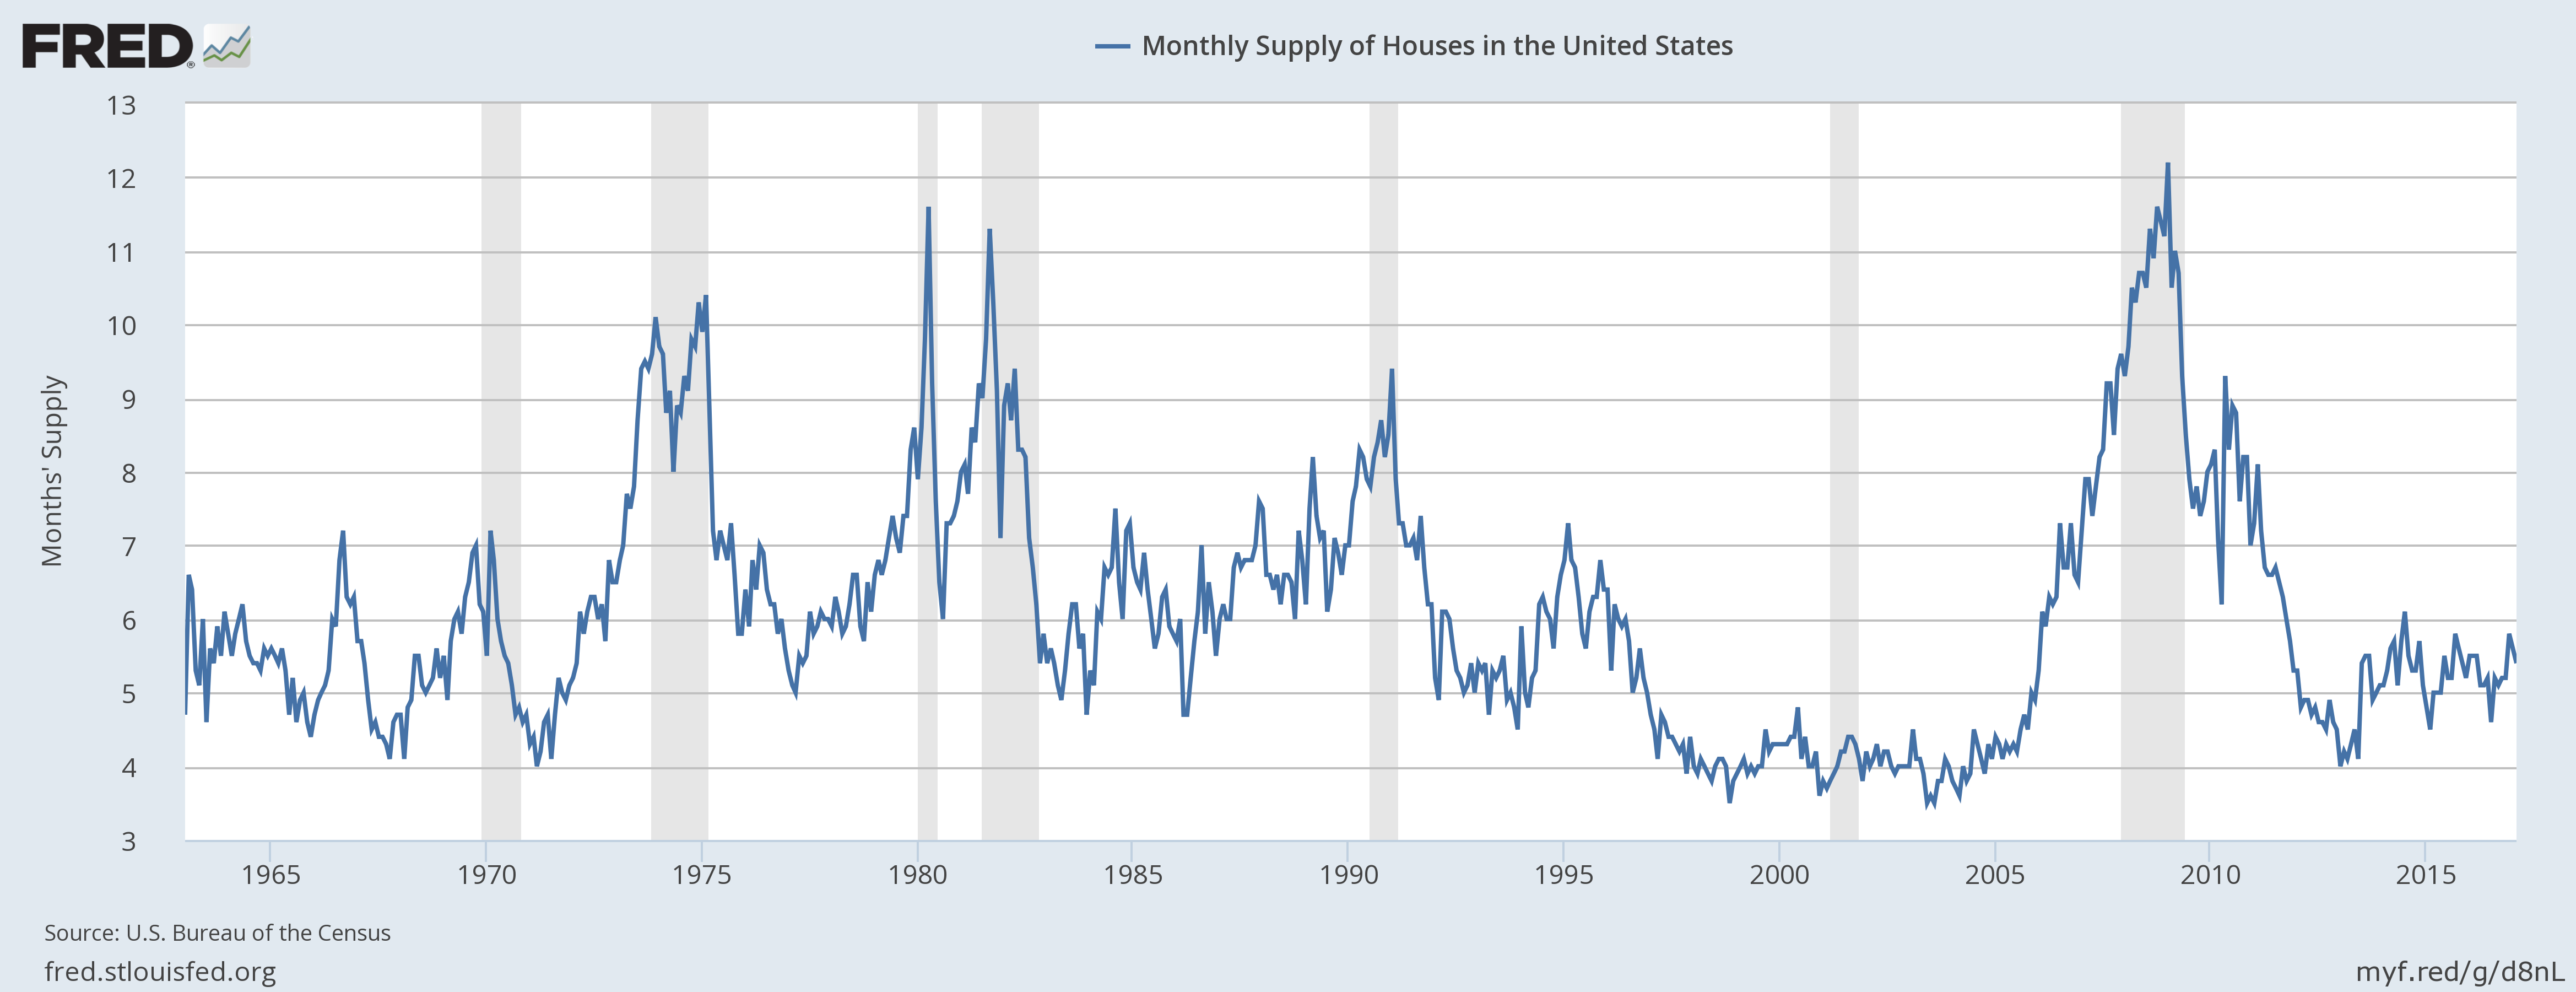
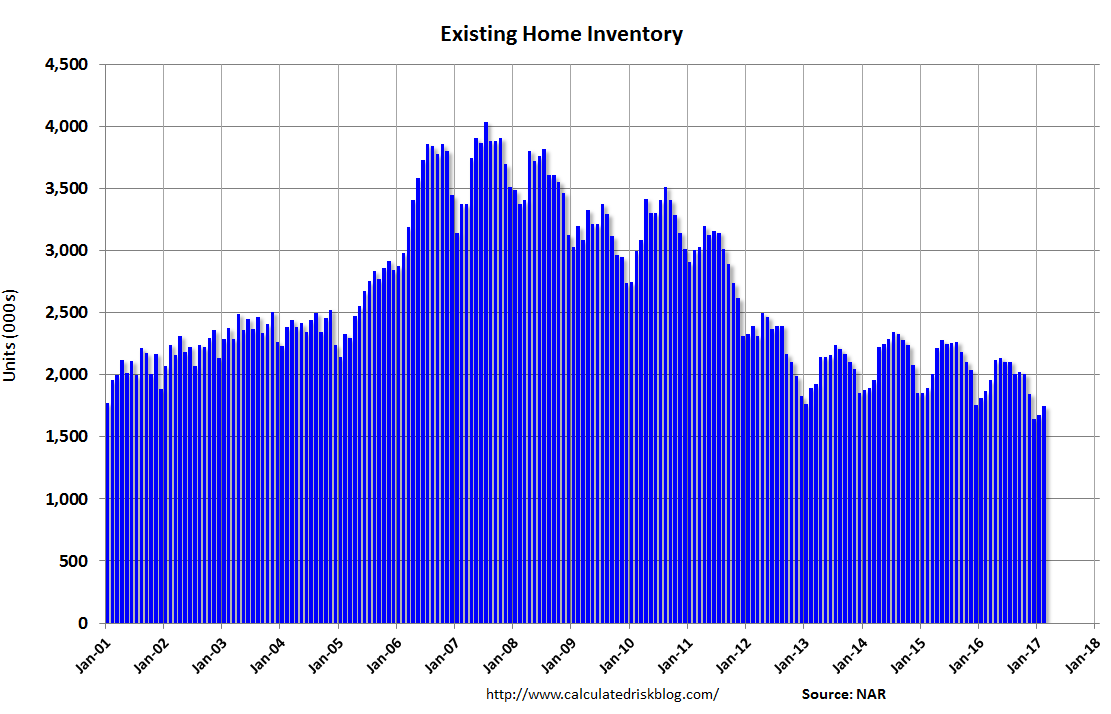
The top chart shows the number of months available for new home sales at the then current annual pace. For the last 3 years, the figure has fluctuated between 5 and 6 months, indicating home builders are expertly managing inventory. In contrast, the existing homes inventory (bottom chart, from Calculated Risk) shows a level below that of the previous expansion. Low inventory not only translates into lower sales but also higher prices.
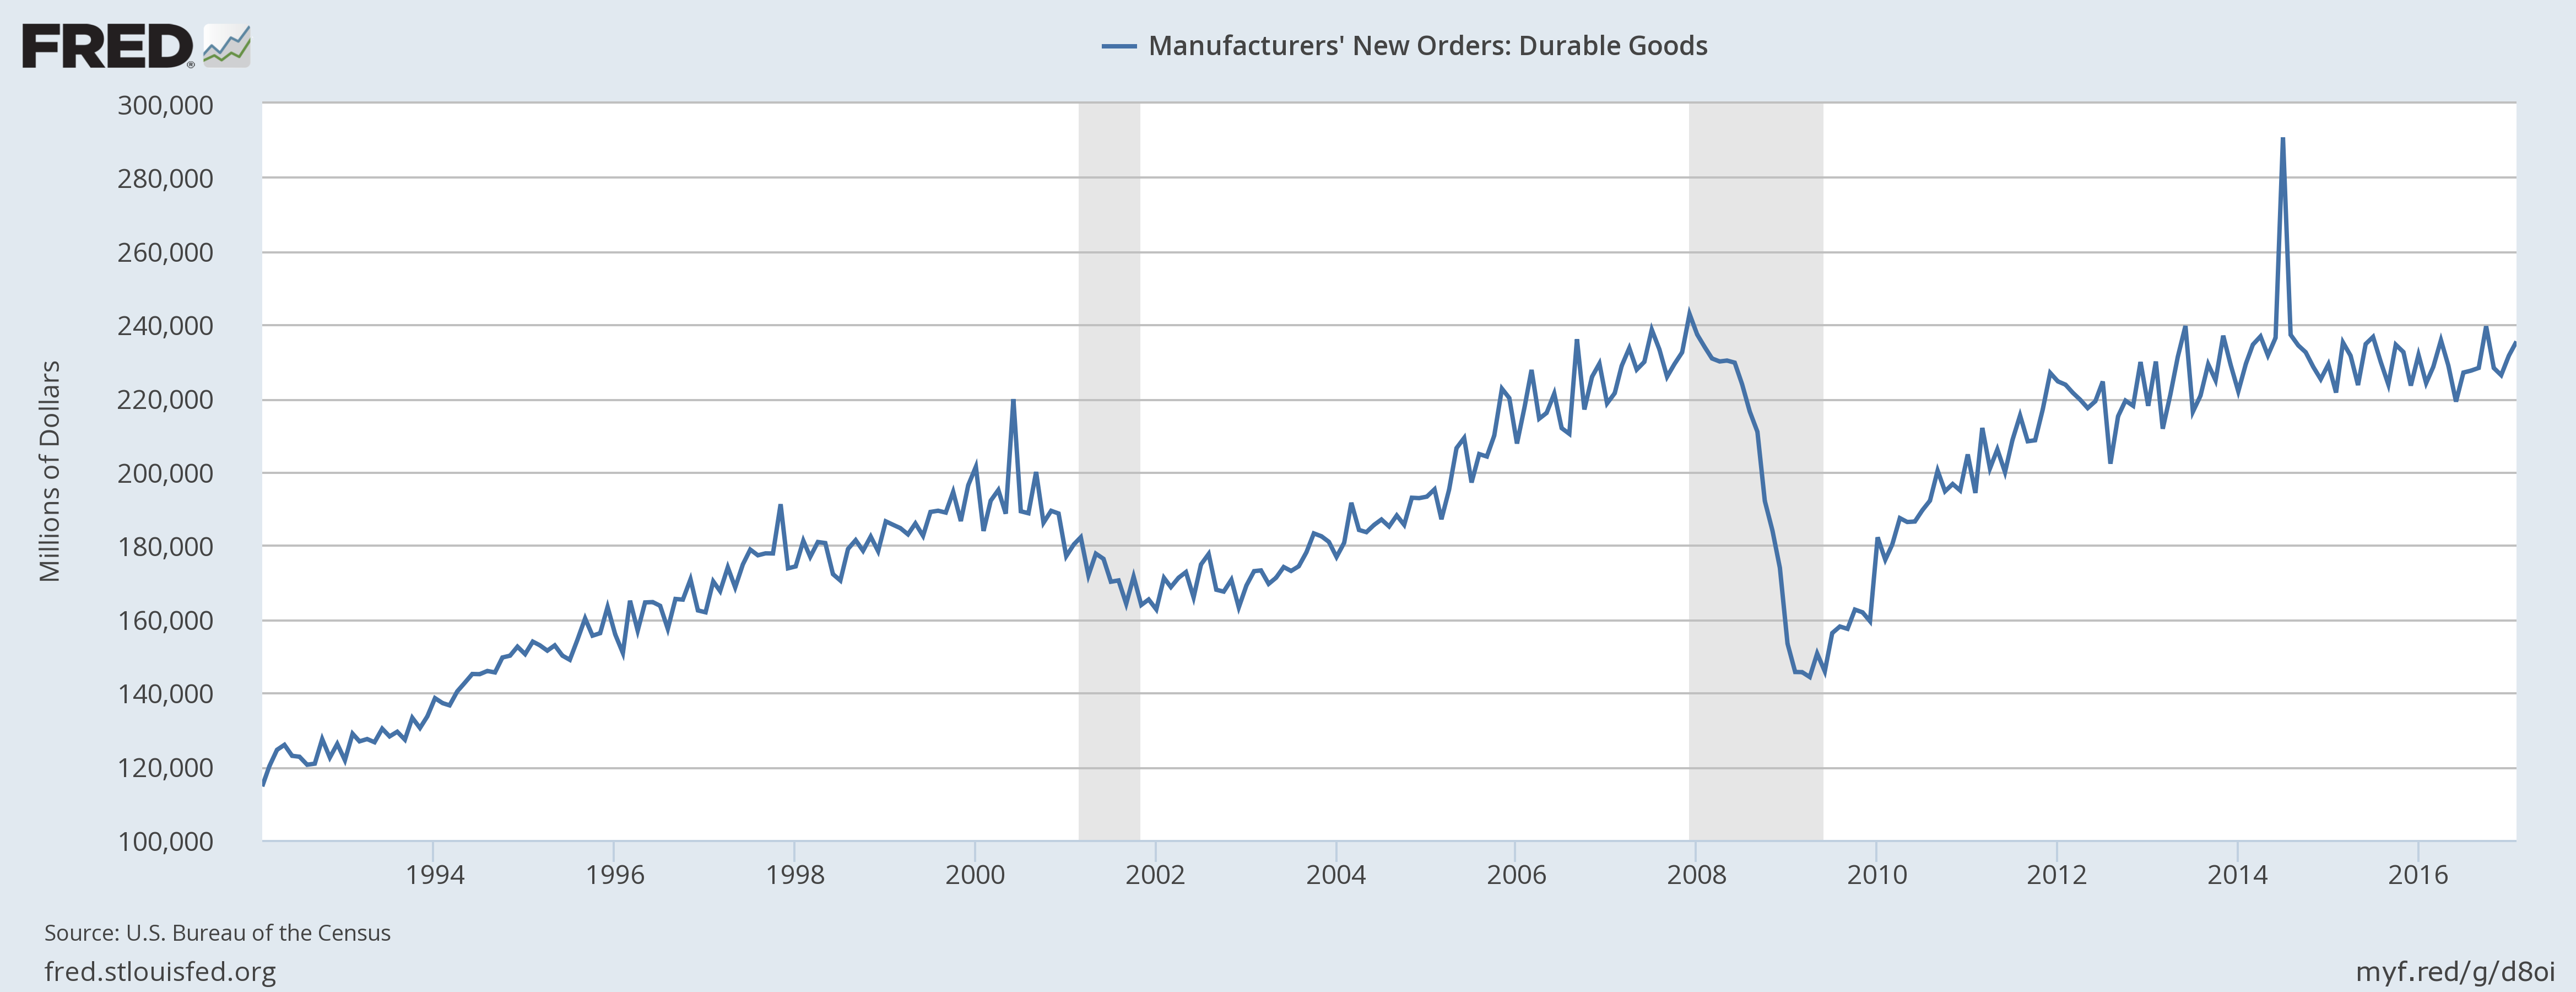
New orders for durable goods rose 1.7% M/M and .4% ex-transport. However, the real story with this series is that it continues its sideways movement between 240 and 260 million monthly orders:
Economic Conclusion: there was insufficient data to make a broad statement about the U.S. economy. However, the housing market, whose health is paramount to continued expansion, is doing well. This is especially important considering the recent increase in 15 and 30 year mortgage rates:
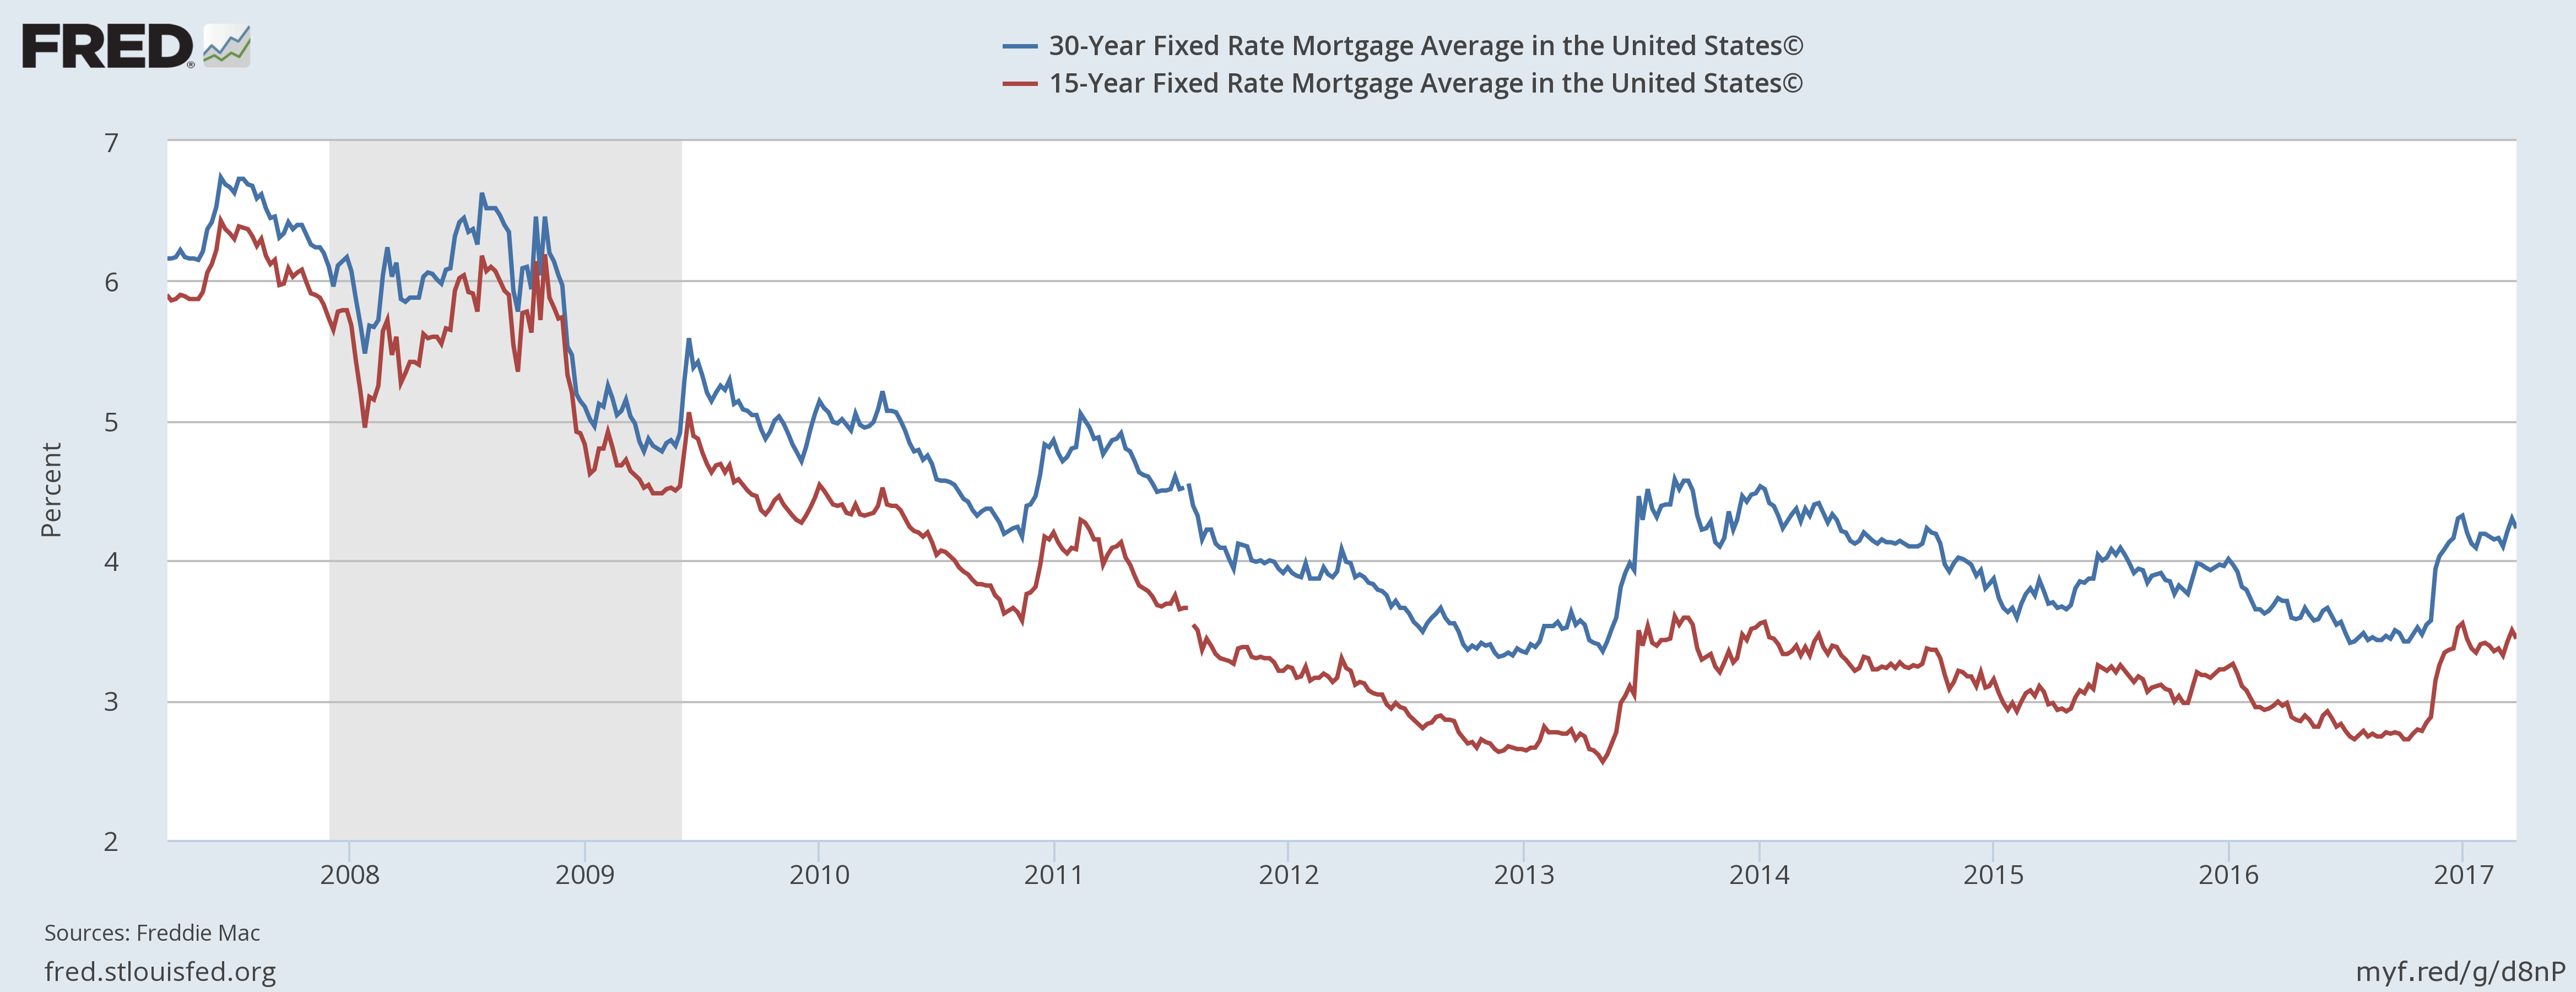
The durable goods news is mildly bullish. Its continued level of 240-260 million orders/month is modestly bullish.
Market Analysis: this week, the markets began their post-election rally correction:

Smaller cap stocks led the way, but larger stocks also fell.
All in all, the daily chart of the SPDR S&P 500 (NYSE:SPY) shows this should not be surprising in any way:
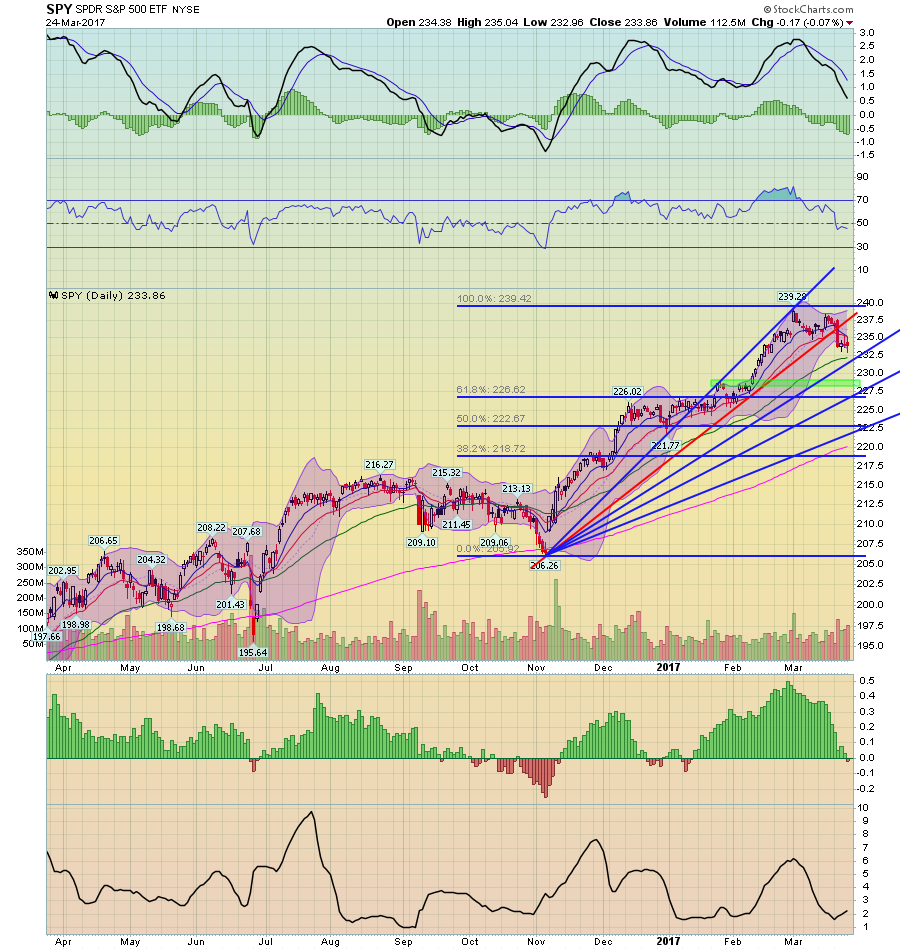
The SPY had a very nice post-election rally. But last week, it broke short-term support (see the red line connecting the early November lows with the early March highs) and is now searching for a short-term bottom. Candidates for support include the 50 day EMA, the top Fibonacci fan, the 62% Fibonacci retracement level and the highs from late February. The market will decide on which level it likes in its own times.
However, also expect numerous click-bait articles that call for a cataclysmic fall. That’s just not in the cards. The underlying economic fundamentals are still good. Long-leading, leading and coincident indicators all point to continued modest growth. Corporate earnings had a great 4th quarter. And while current valuations are high, they are by no means foreboding. In short, the market is in the middle of a standard, run-of-the-mill correction, nothing more.

