Get 40% Off
⚠ Earnings Alert! Which stocks are poised to surge?
See the stocks on our ProPicks radar. These strategies gained 19.7% year-to-date.
Unlock full list

US Equity And Economic Review: New Growth Needed

Published 05/29/2017, 12:31 AM
Updated 07/09/2023, 06:31 AM

On Friday, the BEA released their second estimate of 1Q GDP. This was better, with a 1.2% Q/Q growth rate and 2% Y/Y increased. Best of all, PCEs, investment and exports all posted Y/Y gains:
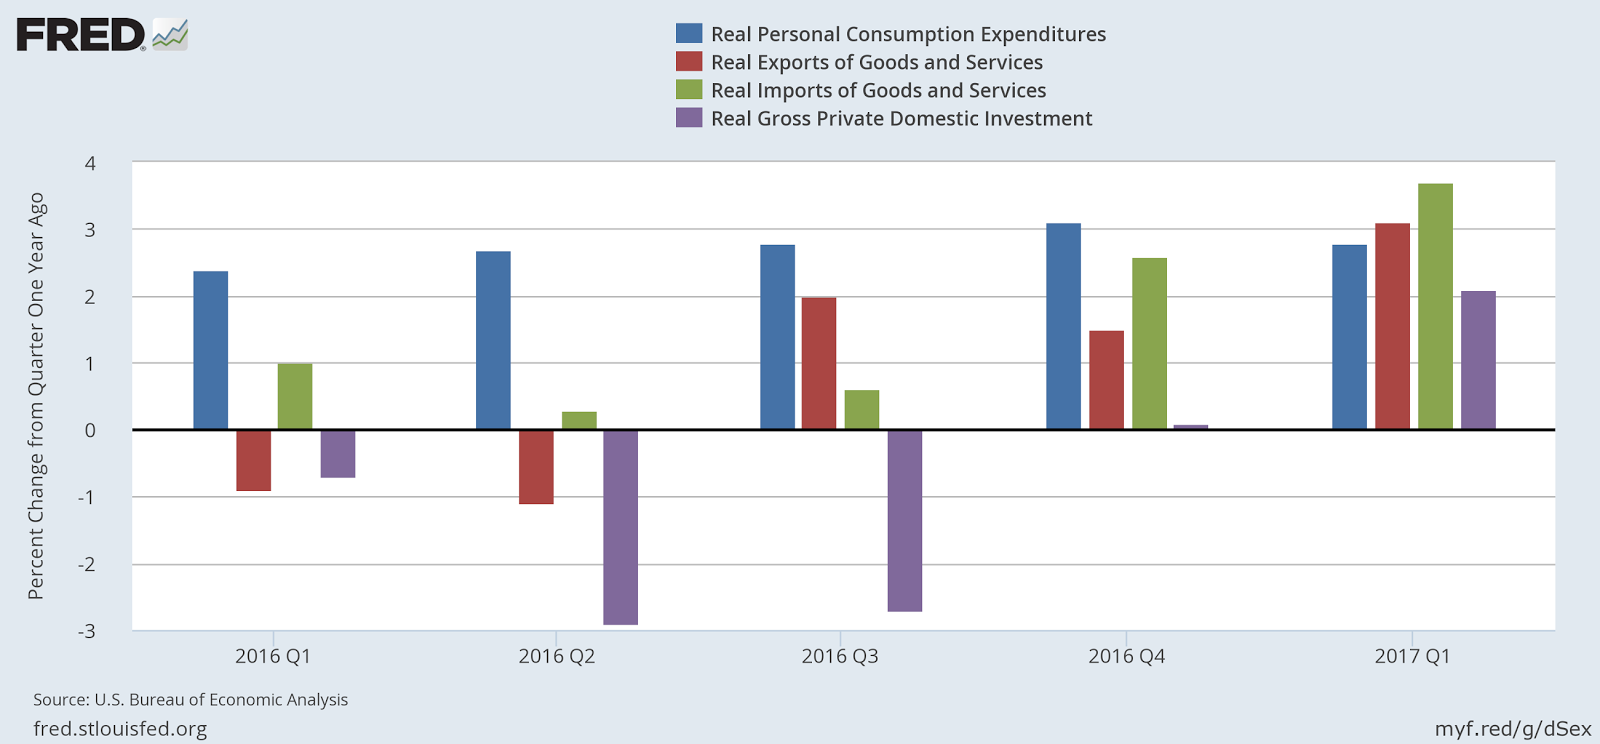
Consumption, exports, imports, and domestic investments 2016-2017

While the overall growth rate is still disappointing, first quarter GDP growth has been subject to a strong seasonality for most of this expansion, so there’s not a lot of reason to worry yet.

Durable goods were up slightly, but continued to print in the 220,000 – 240,000 range:
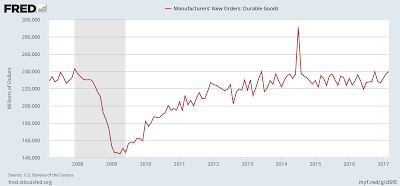
Manufacturers' New Orders: Durable goods

Finally, this week, we learned more about the U.S. housing market. Existing home sales fell 2.3% M/M but rose 1.6% Y/Y. However, the 3, 6 and 12 month average annual pace of existing sales is still rising:
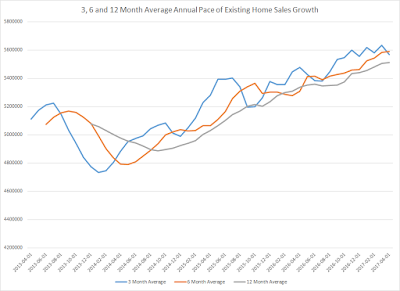
3, 6, and 12 month avg. annual pace of existing home sales growth

New Home sales declined a large 11.4%, but were up .5% Y/Y:
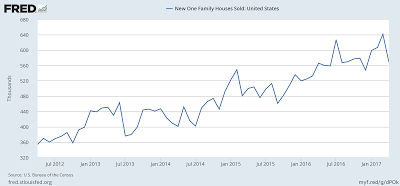
New one family houses sold in the US

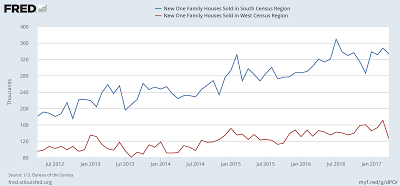
The chart shows that large drops are rare, but not unprecedented. There have been 4 such declines in the last 5 years. Regional data highlights the weak areas:
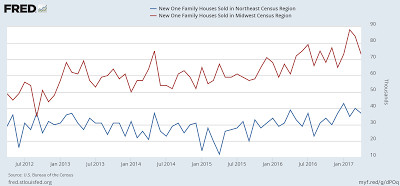
New one family homes sold in NE vs. midwest

New one family homes sold in south vs. west

In both charts, the red line represents the region with the sharpest decline. In the top chart it’s the Midwest region while in the bottom chart, it’s the West region. But as with existing home sales, the 3, 6 and 12 month average annual pace of sales growth is increasing:
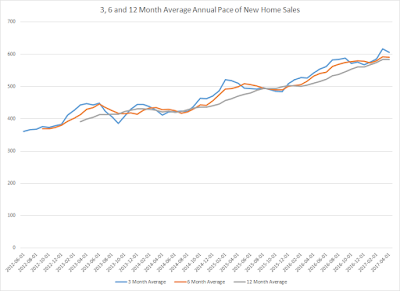
3, 6, and 12 month average annual pace of new home sales

Mortgage rates aren’t the culprit:

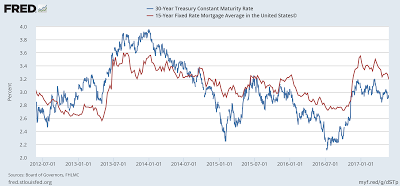
30yr Treasury Constant Maturity Rate vs. 15yr Fixed Rate Mort. Avg

While both 15 and 30 year mortgages rose after the election, current levels are still low by comparison to other times in this expansion

Economic Conclusion: overall, the U.S. economy is still in good shape. While 1Q growth was

still slow, the second estimate did contain an increase. Durable good sales are still within the 220,000-240,000 range, indicating that while orders are not increasing, they are at least being sustained. Although the monthly housing market data was weaker than we’d want, the trends are still positive.

Market Analysis: The good news this week is the SPDR S&P 500 (NYSE:SPY) finally broke through the upper 230s, which had provided resistance since the beginning of March:
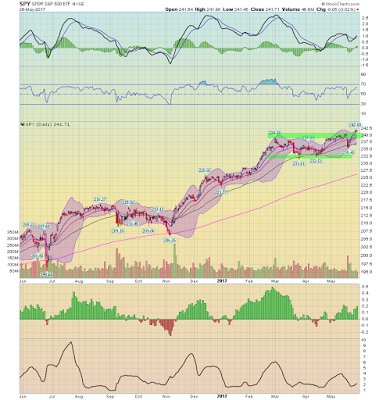
SPY Daily

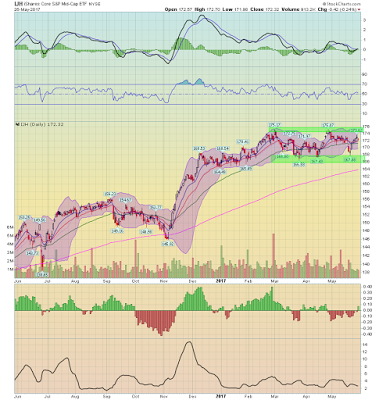
The MACD indicates there is additional upside momentum if the market wants to continue rallying. The problem is the small and midcap indexes failed to confirm the rally:
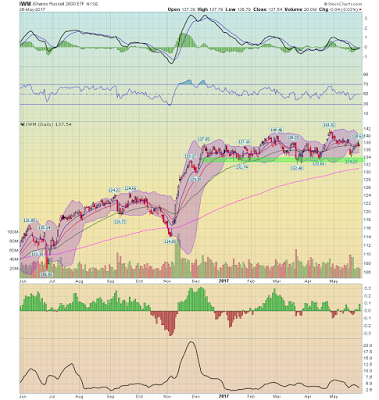
IWM Daily

IJH Daily

This is not fatal; it could simply be that these indexes will move higher in the next few weeks. But also consider that 3 of the 4 leading industry sectors are defensive:

Industry Chart

Health care, consumer staples and utilities sectors are leading the market higher.

Despite the small SPY rally, the market is still expensive, with both the current and forward PEs high. As I’ve concluded for the last few years, we need continued earnings and economic growth for the market to continue meaningfully higher.

Original post

Latest comments

Risk Disclosure: Trading in financial instruments and/or cryptocurrencies involves high risks including the risk of losing some, or all, of your investment amount, and may not be suitable for all investors. Prices of cryptocurrencies are extremely volatile and may be affected by external factors such as financial, regulatory or political events. Trading on margin increases the financial risks.
Before deciding to trade in financial instrument or cryptocurrencies you should be fully informed of the risks and costs associated with trading the financial markets, carefully consider your investment objectives, level of experience, and risk appetite, and seek professional advice where needed.
Fusion Media would like to remind you that the data contained in this website is not necessarily real-time nor accurate. The data and prices on the website are not necessarily provided by any market or exchange, but may be provided by market makers, and so prices may not be accurate and may differ from the actual price at any given market, meaning prices are indicative and not appropriate for trading purposes. Fusion Media and any provider of the data contained in this website will not accept liability for any loss or damage as a result of your trading, or your reliance on the information contained within this website.
It is prohibited to use, store, reproduce, display, modify, transmit or distribute the data contained in this website without the explicit prior written permission of Fusion Media and/or the data provider. All intellectual property rights are reserved by the providers and/or the exchange providing the data contained in this website.
Fusion Media may be compensated by the advertisers that appear on the website, based on your interaction with the advertisements or advertisers.
© 2007-2024 - Fusion Media Limited. All Rights Reserved.