This past week’s news was positive. The BEA released their first estimate of 3Q GDP -- a healthy 3% annual rate. The Chicago Fed’s National Activity Index increased and durable goods orders were up. New home sales also increased. While a large, post-Harvey surge in the South was mostly responsible, there were also increases in the three other regions.
This week, the BEA released their first estimate of 3Q GDP, which was up 3% on an annual basis and 2.3% on a Y/Y basis. The one area of concern was the continued decline in residential investment, which only rose .9% in the latest quarter and has been declining for the last 5. But durable goods consumption expenditures were strong (up 8.3% Y/Y). And nonresidential investment spending on equipment rose a healthy 5.2%. Overall, this was a good report.
On Monday, the Chicago Fed released their latest National Activity Index. On one hand, this is a great indicator; it combines 85 individual statistics into a simple, fairly easy to understand number. On the other hand, the large number of indicators makes this index a bit unwieldy. The index does, however, have a good record tracking the current state of the US economy.

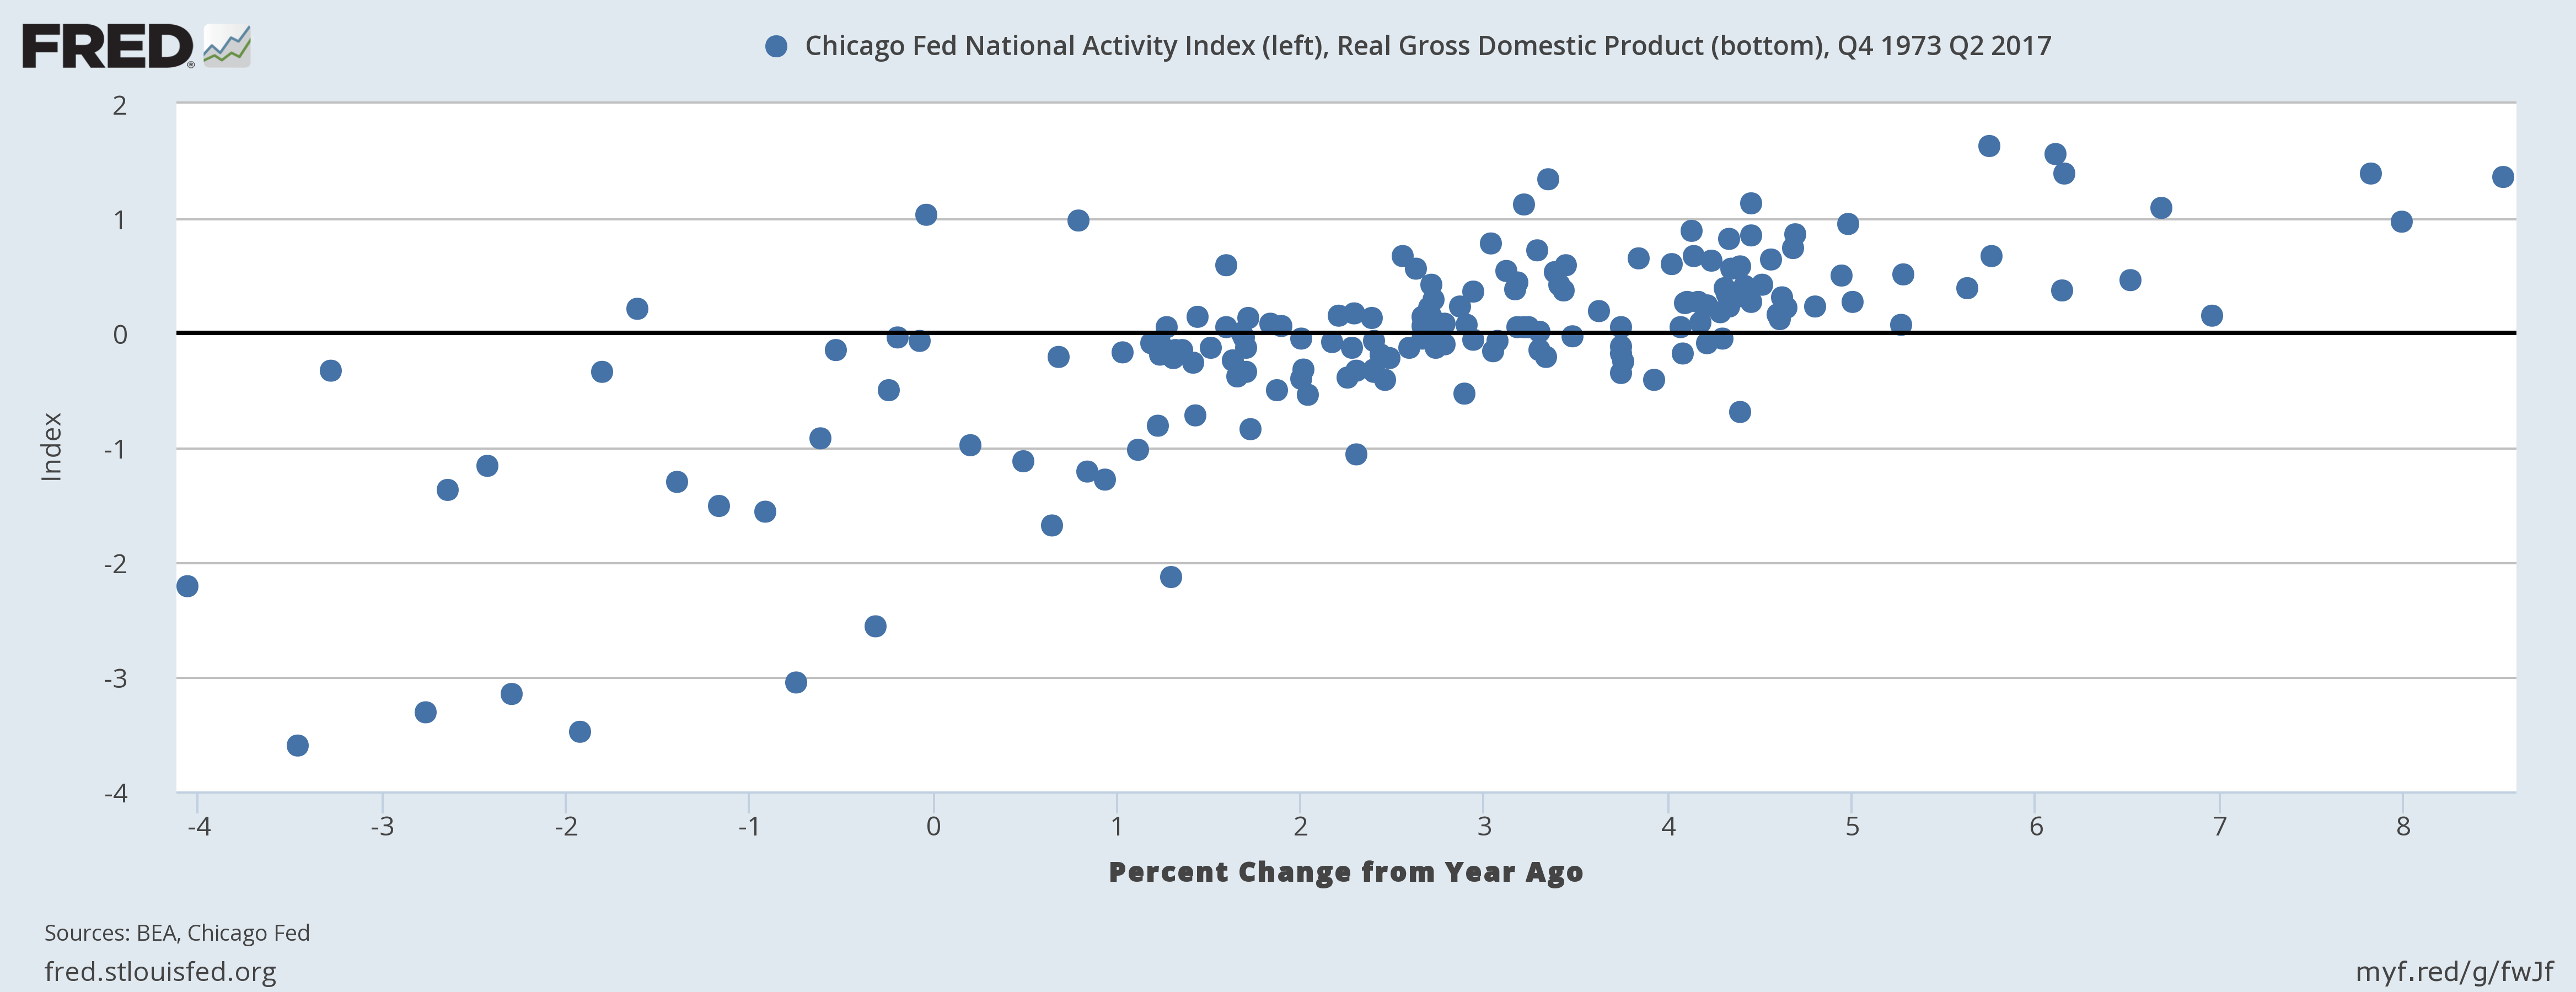
Above is a scatterplot of the quarterly Y/Y percentage change in real GDP and the CFNAI; the two numbers have a .72 correlation – which is statistically significant.
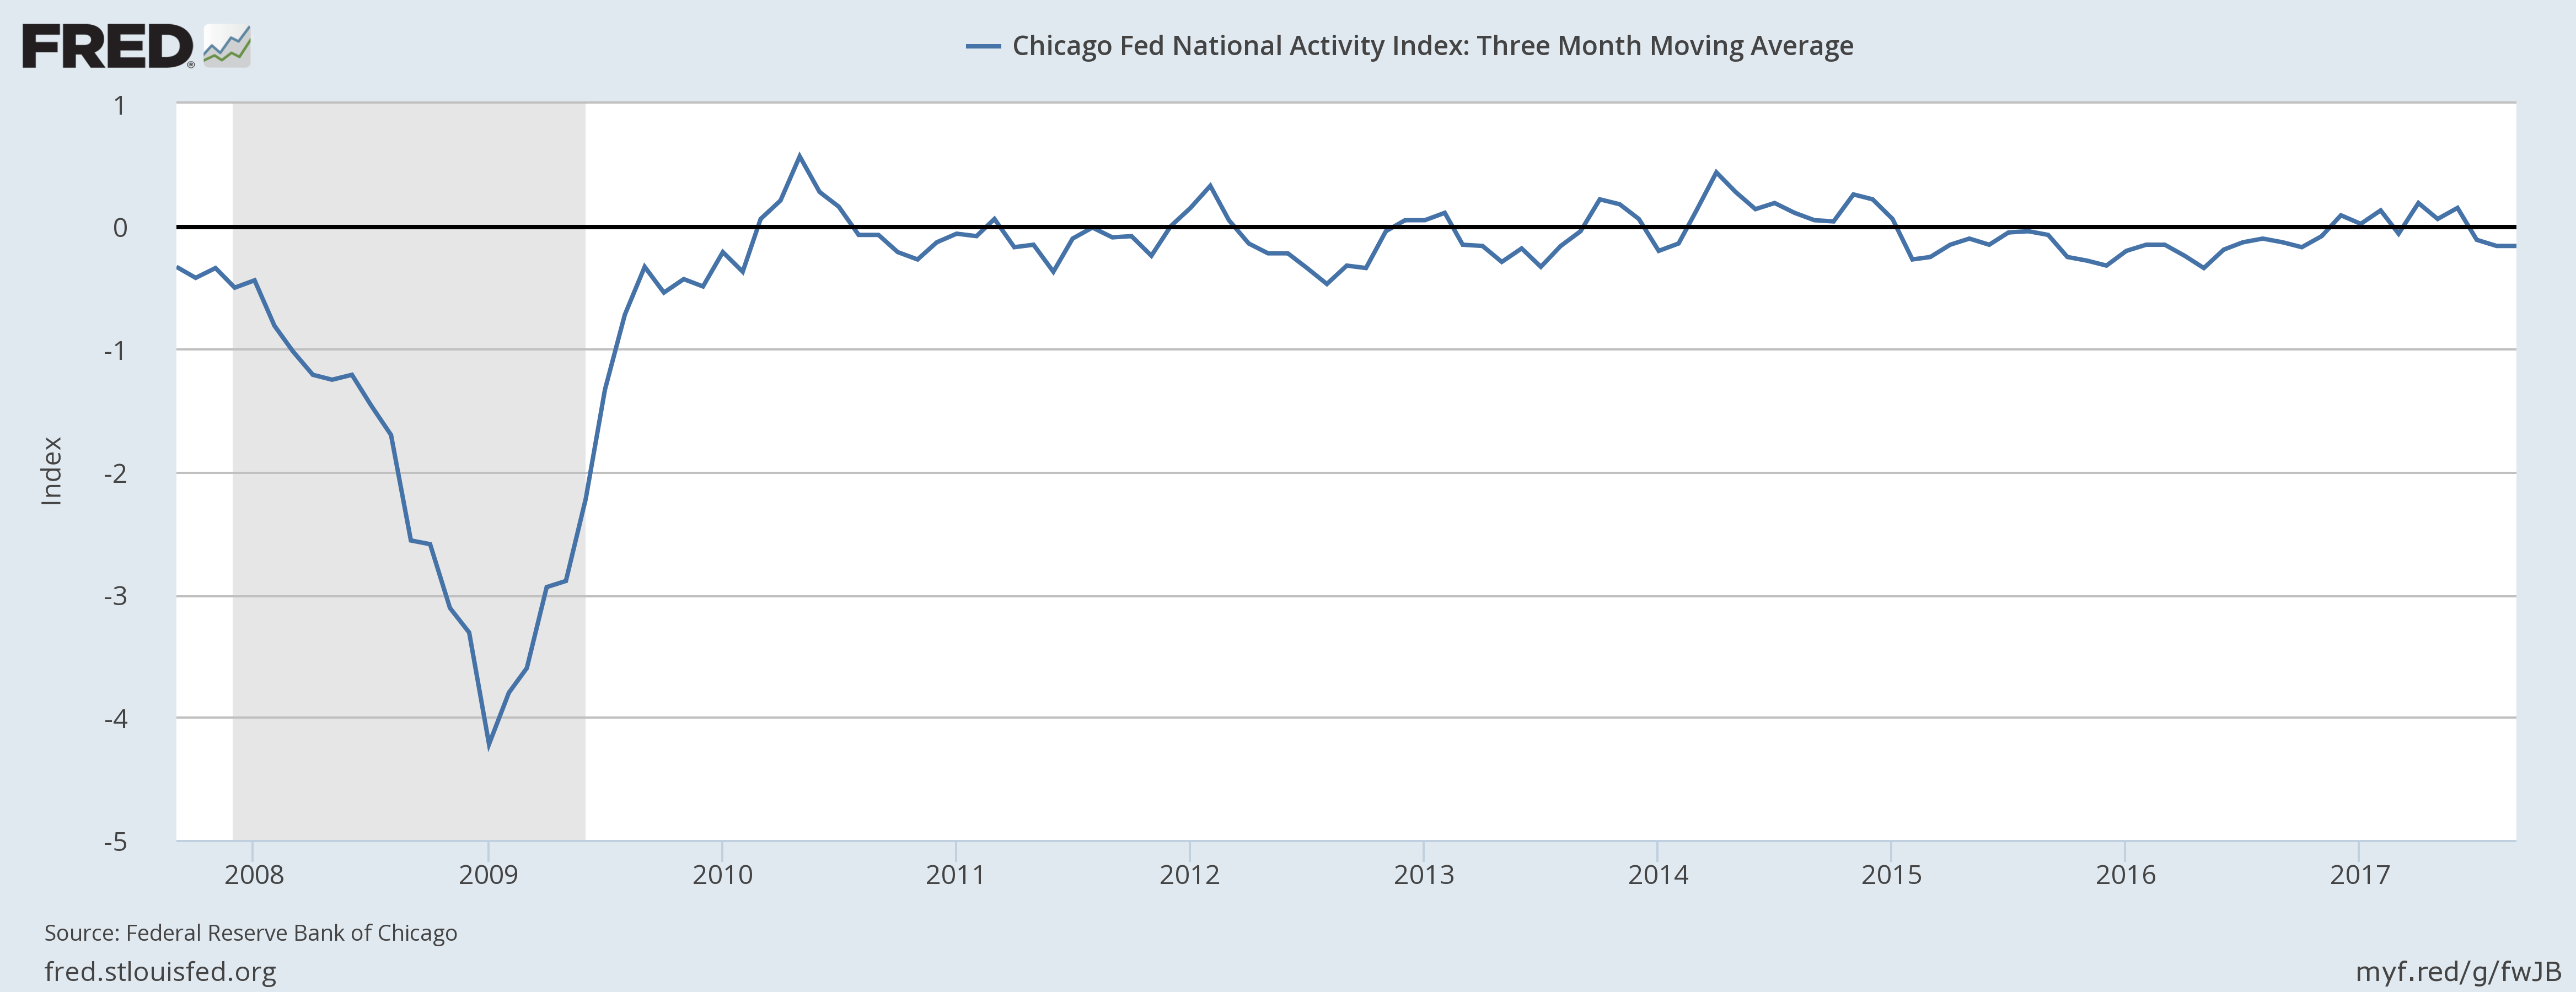
The index ticked higher last month:
Led by improvements in production-related indicators, the Chicago Fed National Activity Index (CFNAI) moved up to +0.17 in September from –0.37 in August. All four broad categories of indicators that make up the index increased from August, and three of the four categories made positive contributions to the index in September. The index’s three-month moving average, CFNAI-MA3, was unchanged at –0.16 in September.
The three-month moving average takes out some of the noise:

In general, readings above O indicates above-average growth while those below 0 indicate below average growth.
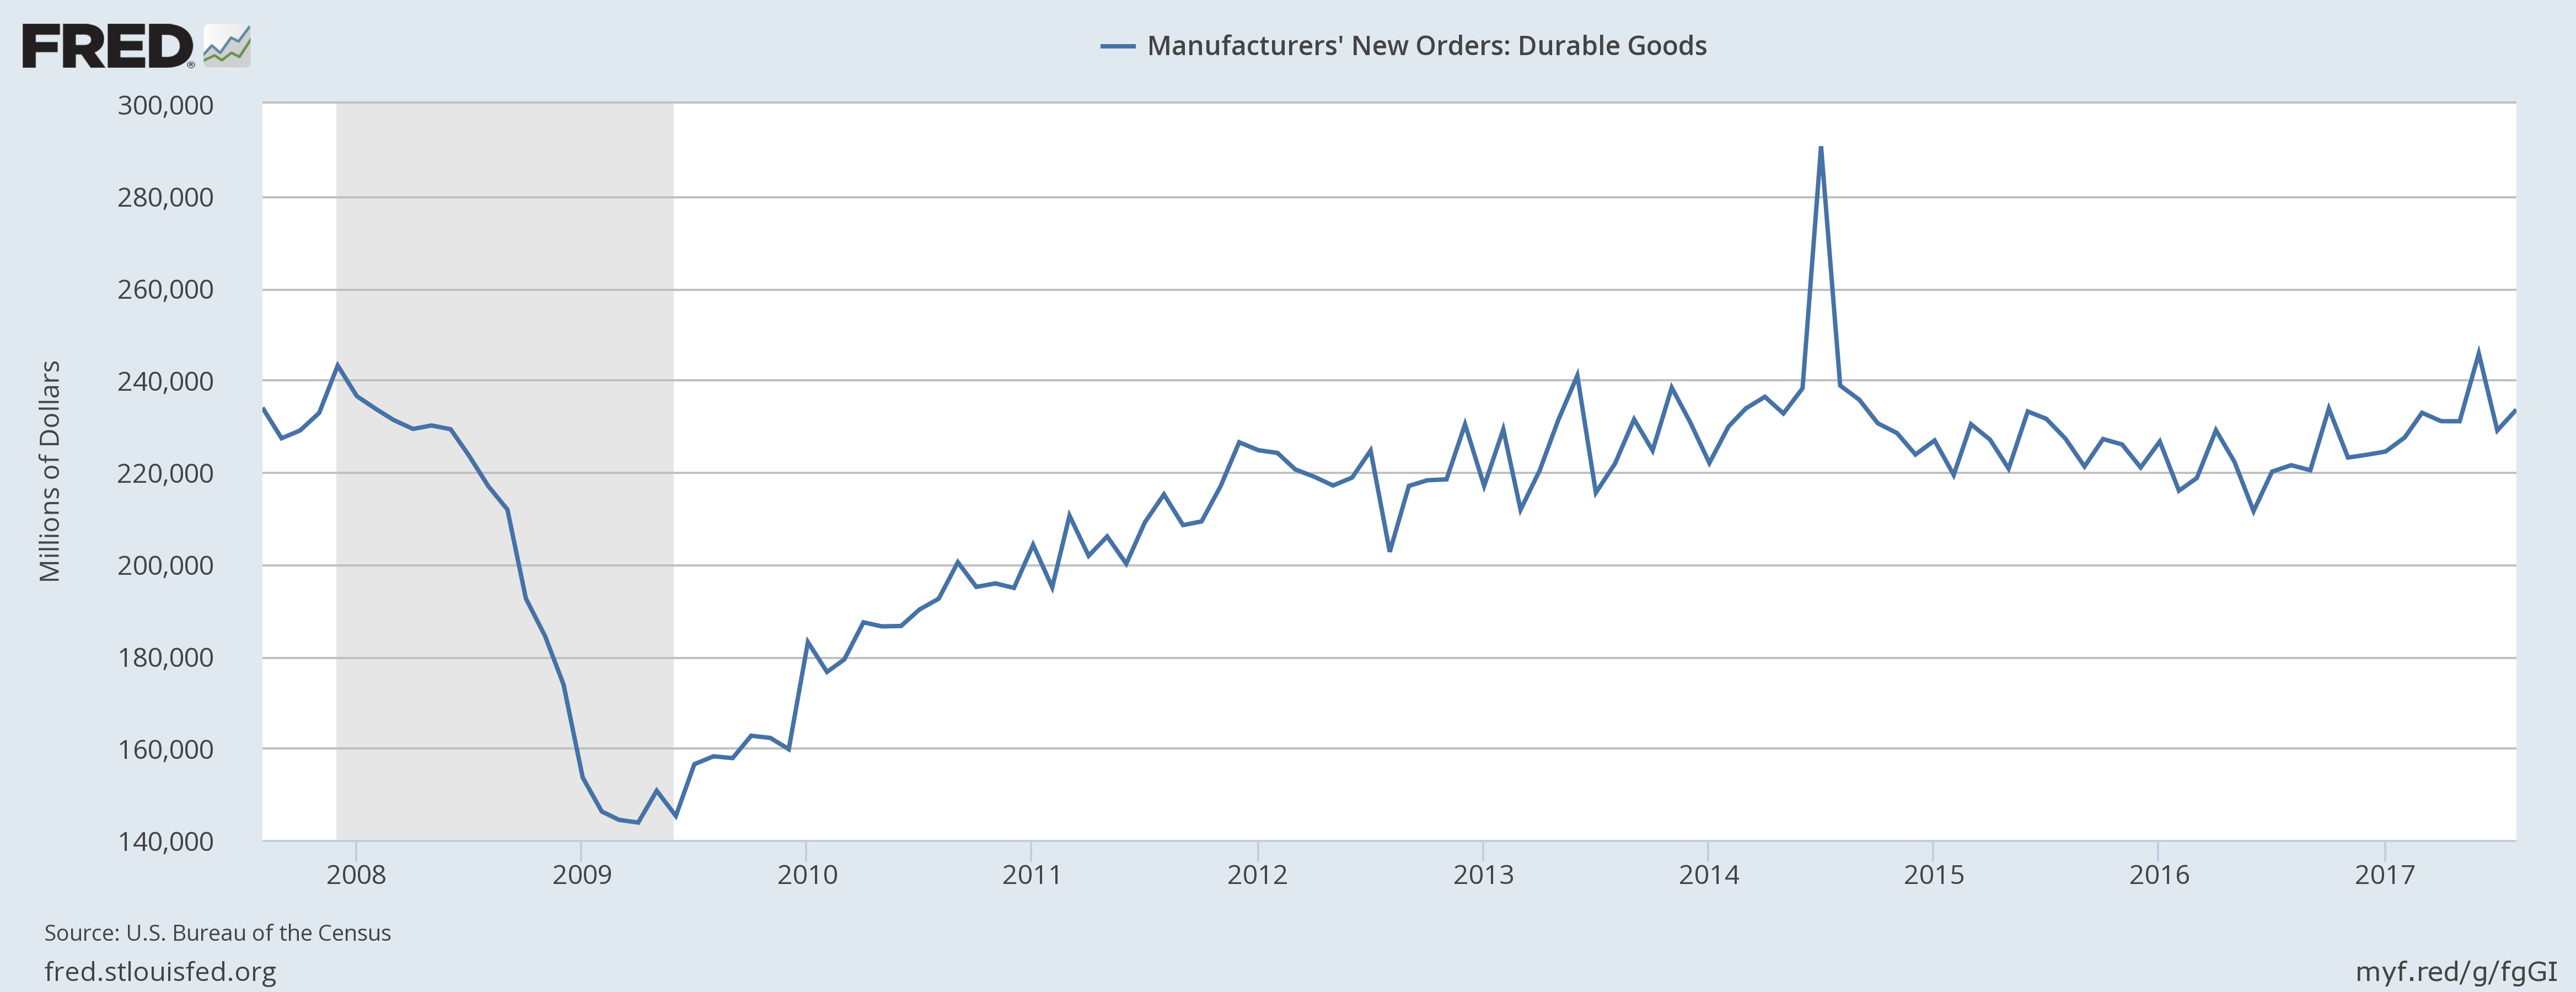
The Census Bureau released the latest durable goods report on Wednesday. Total orders increased 2%; they rose .7% ex-transport. Non-defense capital goods were up 6.1%, but this is likely influenced by post-Harvey and Irma rebuilding. Overall, this data set is still printing between $220-$240 billion on a monthly basis:

New homes sales rose 18.9%. But this data comes with a large caveat: sales in the South – which recently experienced hurricanes – rose 25.8%. Because the Southern region comprises 60% of the market, this month’s increase had a disproportionate impact. Expect this number to drop in the next few months. That number aside, sales in other regions were also higher: Northeastern sales advanced 33.3%; Western sales rose 2.9% and Mid—Western sales were 10.76% higher.
Next week we’ll see several important releases, starting with personal income and PCE inflation (the Fed’s preferred measure) on Monday. ISM will release their latest reports on manufacturing and services. And on Friday, the BLS will release the latest employment report.
