Summary
- Friday's Employment Report was especially strong.
- The manufacturing sector is also doing well.
- The Fed sees an economy that is growing modestly.
Let's begin with the Federal Reserve's Beige Book, which, as usual, offers a good overview of the current situation:
Economic activity expanded moderately in late April and early May with few shifts in the pattern of growth. The Dallas District was an exception, where overall economic activity sped up to a solid pace. Manufacturing shifted into higher gear with more than half of the Districts reporting a pickup in industrial activity and a third of the Districts classifying activity as "strong." Fabricated metals, heavy industrial machinery, and electronics equipment were noted as areas of strength. Rising goods production led to higher freight volumes for transportation firms. By contrast, consumer spending was soft. Nonauto retail sales growth moderated somewhat and auto sales were flat, although there was considerable variation by District and vehicle type. In banking, demand for loans ticked higher and banks reported that increased competition had led to higher deposit rates. Delinquency rates were mostly stable at low levels. Homebuilding and home sales increased modestly, on net, and nonresidential construction continued at a moderate pace. Contacts noted some concern about the uncertainty of international trade policy. Still, outlooks for near term growth were generally upbeat. (emphasis added)
Manufacturing is currently doing very well. This graph from Adviser Perspectives shows all the Federal Reserve Bank's regional manufacturing indicators:
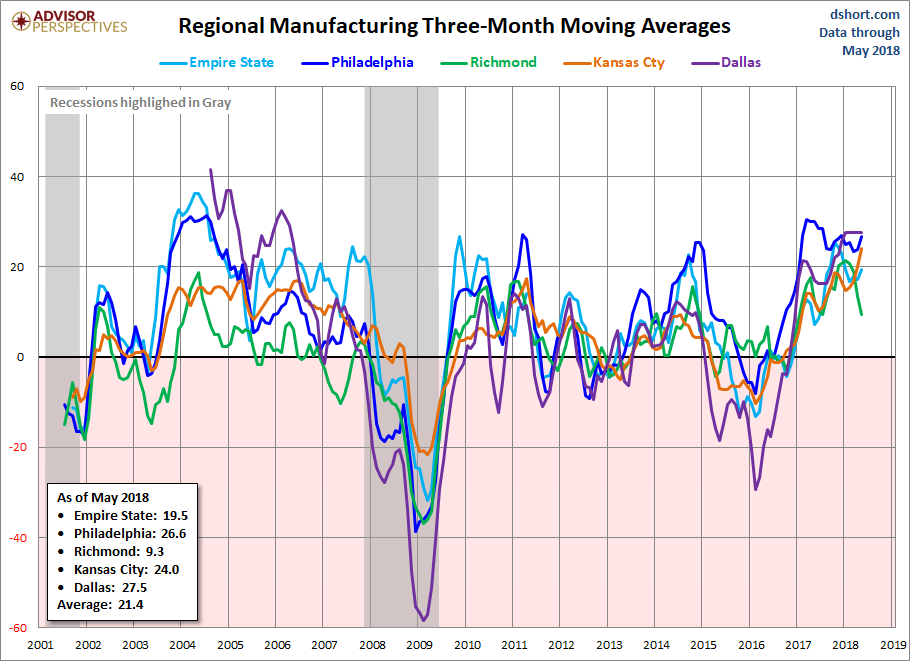
These indexes have been at high levels since early 2017, which shows that manufacturing is in the middle of its strongest expansion since the Great Recession. This was confirmed by Friday's release of the ISM Manufacturing report, with a headline number of 58.7. The new orders, production, and employment components of the report were all higher.
Rising manufacturing sentiment has led to an increase in the pace of manufacturing industrial production:
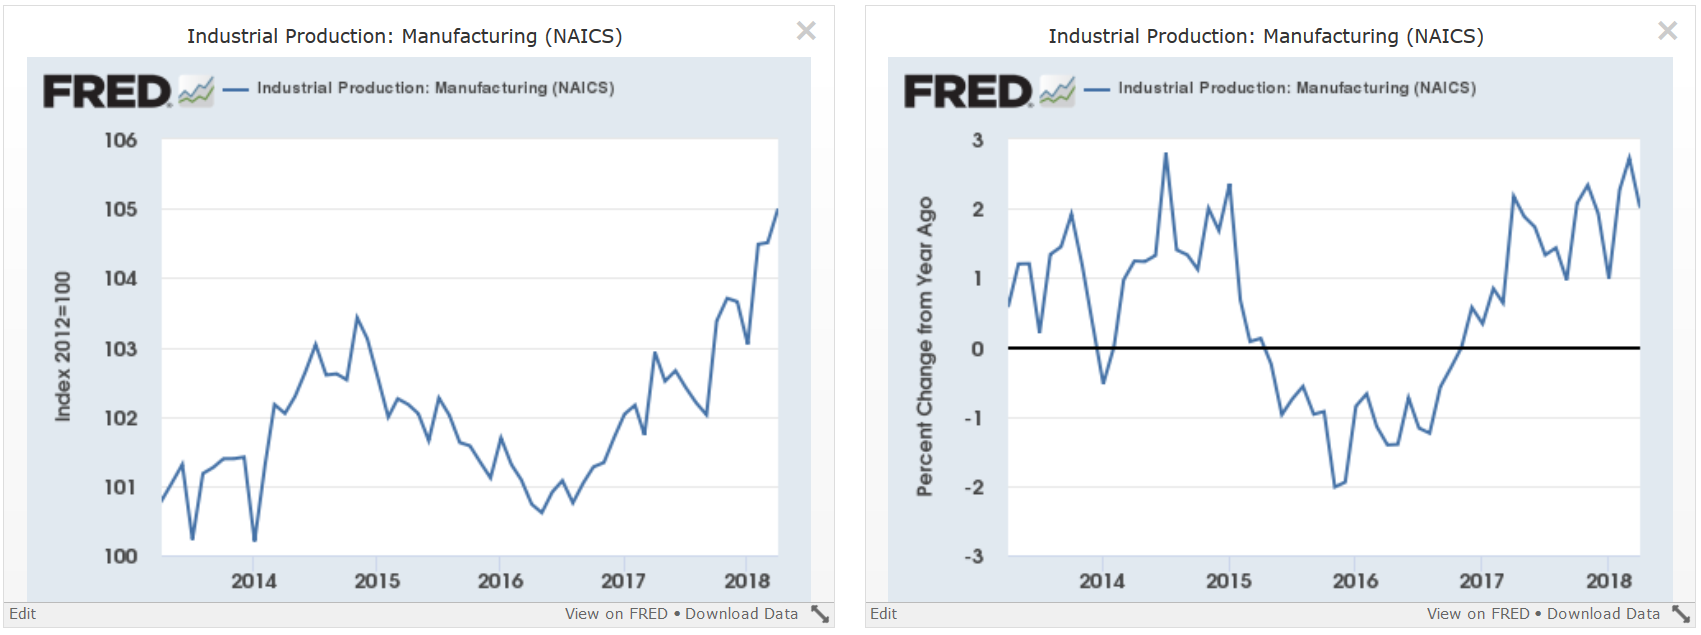
Manufacturing started to increase in early 2016. It has been increasing since (left chart). The pace of Y/Y percentage increases turned positive in 2017 (right chart) and has been printing at a 1-2% pace for the last year.
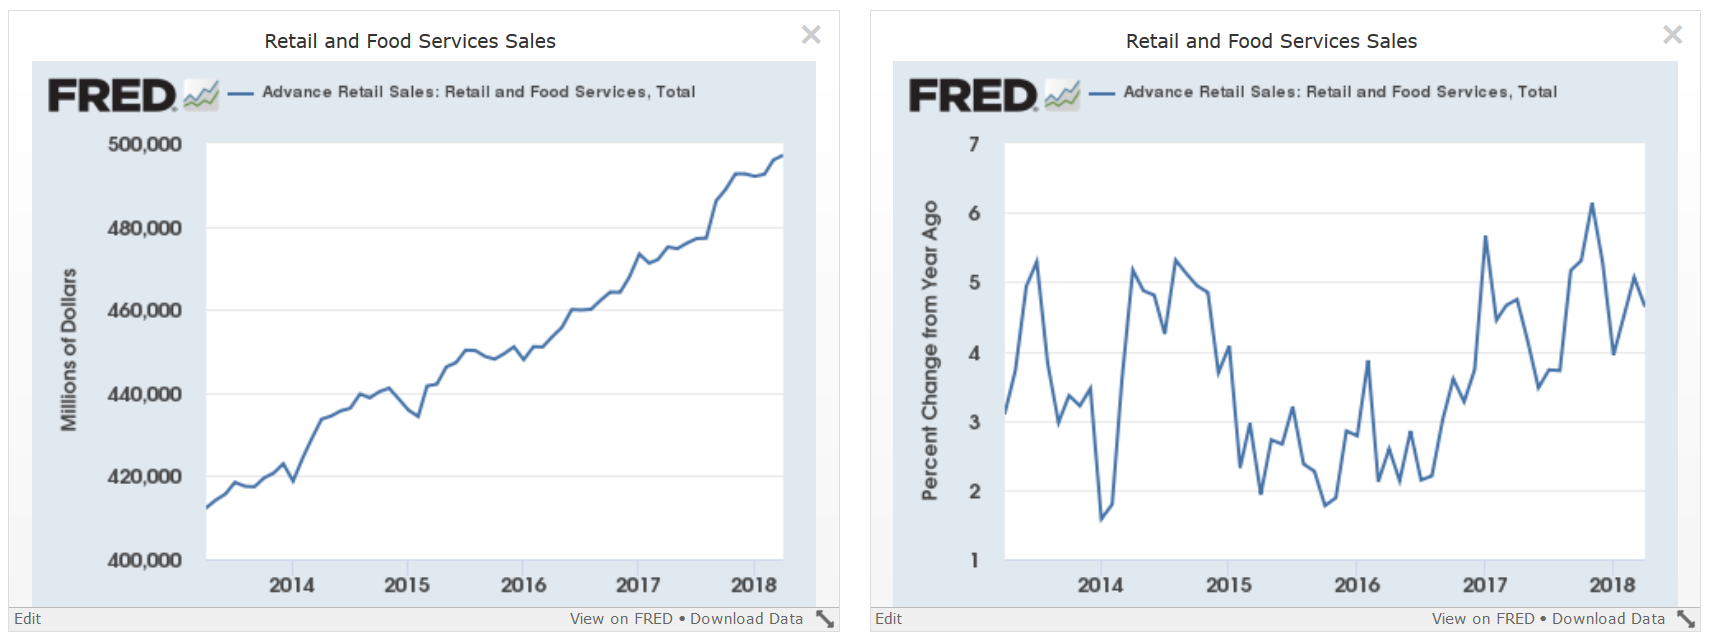
As for retail sales, the national pace continues to be strong:
The latest PCE report from the BEA also shows a strong pace of consumer spending:
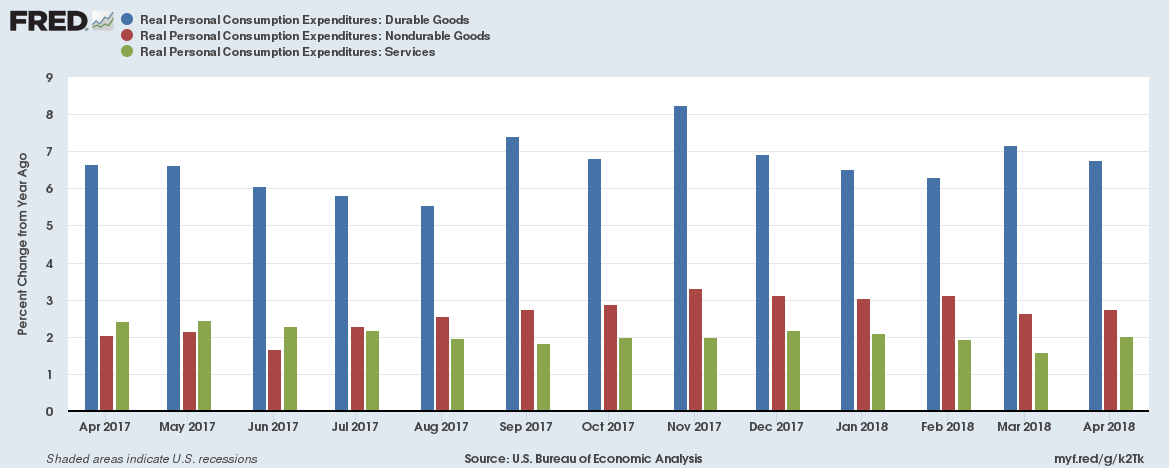
The above chart shows the data in Y/Y format. Note its consistency. The durable goods purchases are the most important; they show a consumer that is very confident about the future. This week's auto and light truck sales confirm this strength:
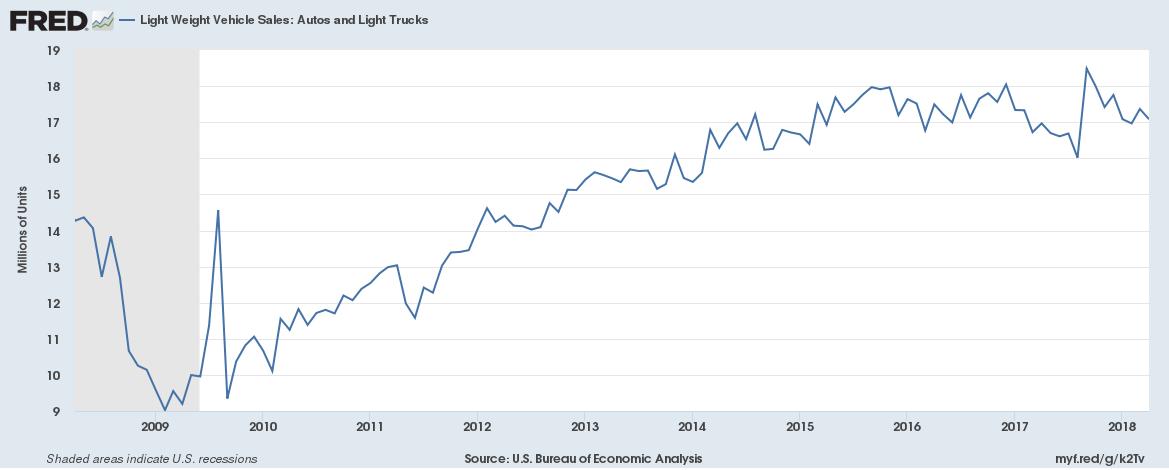
While they were down modestly, they continue to print at the upper end of their range for this expansion. And the other two areas of PCE spending (non-durable and service expenditures) are rock-solid in their regularity.
The weakness referred to by the Fed is most likely regional, caused by inclement weather in the 1Q18.
And that brings us to Friday's employment report, which had a headline number of 223,000. But rather than use the monthly number, it's best to rely on moving averages, which smooth out the monthly gyrations.
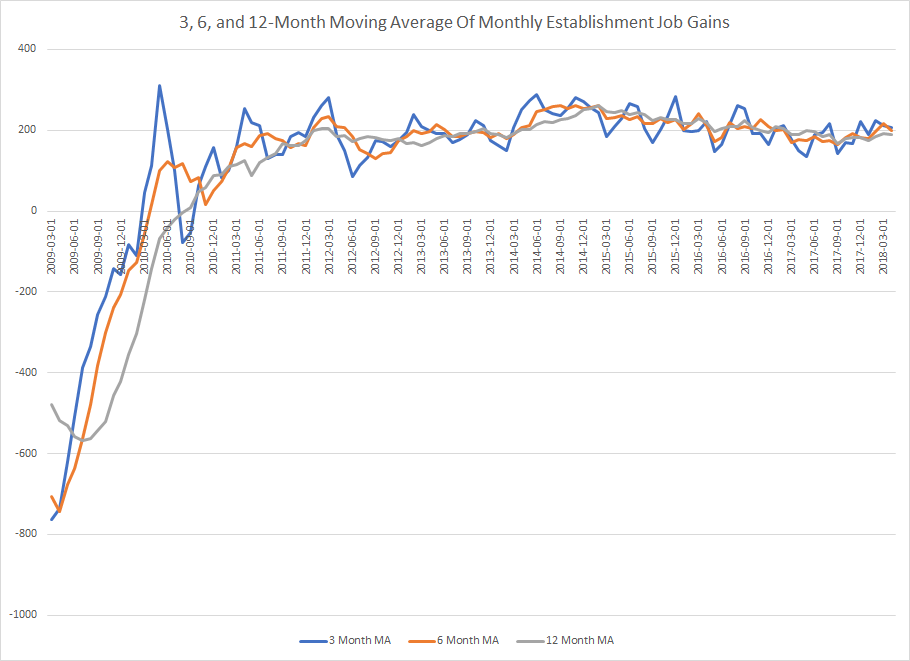
(data from the BLS; author's calculations).
The 3, 6, and 12-month moving averages are clustered around the 200,000 level - an impressive feat for a labor market this far into an expansion.
Turning to the Household survey, we get the following data:
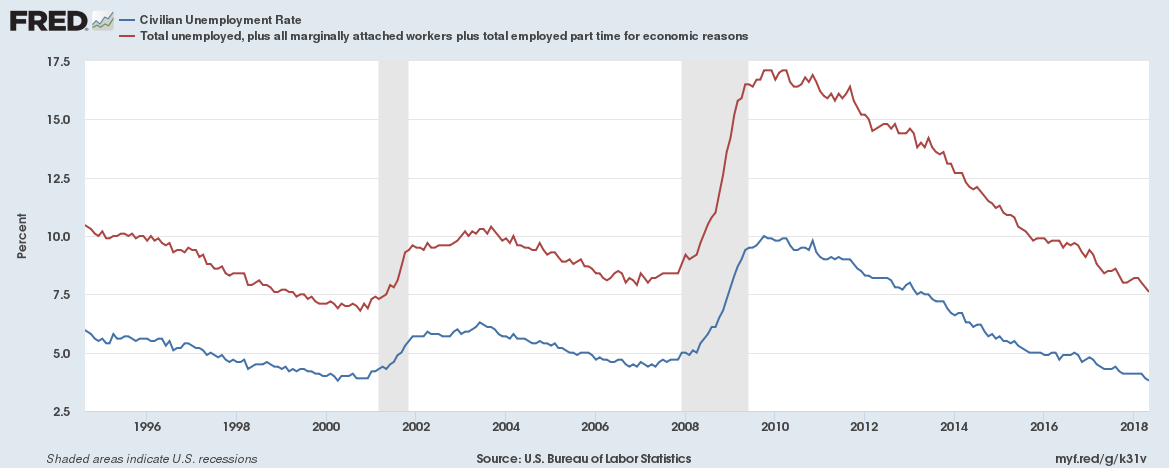
The U-6 (in red) and U-3 rates (in blue) of unemployment continue to trend lower. The unemployment rate is at its lowest rate in 20+ years, while marginally attached workers are nearing that level.
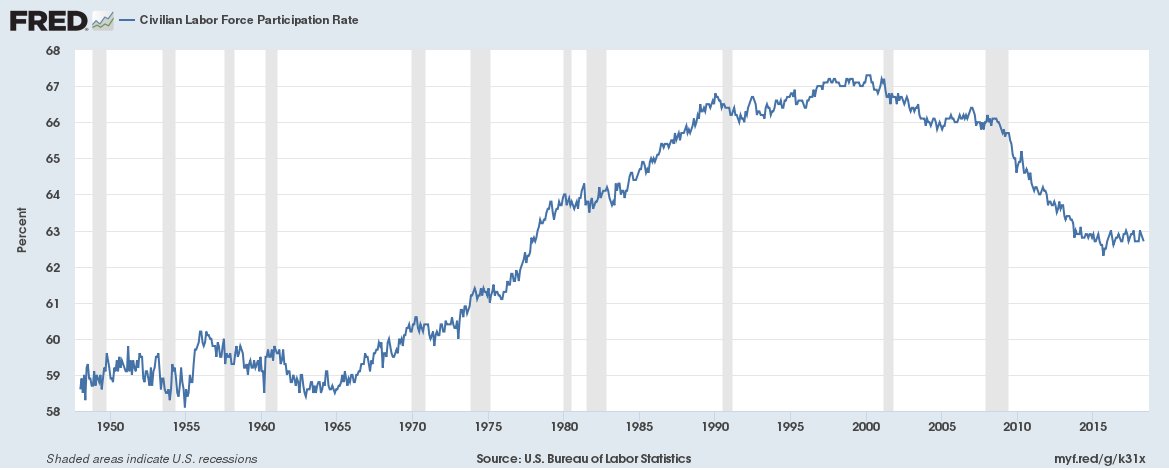
The Labor Force Participation Rate is holding steady right below 63%. Due to the retiring of the baby-boomers, it's doubtful we'll see this number move much higher. However, the fact that it's holding steady indicates that the jobs market is strong enough to pull people back into the labor market, which is due to...
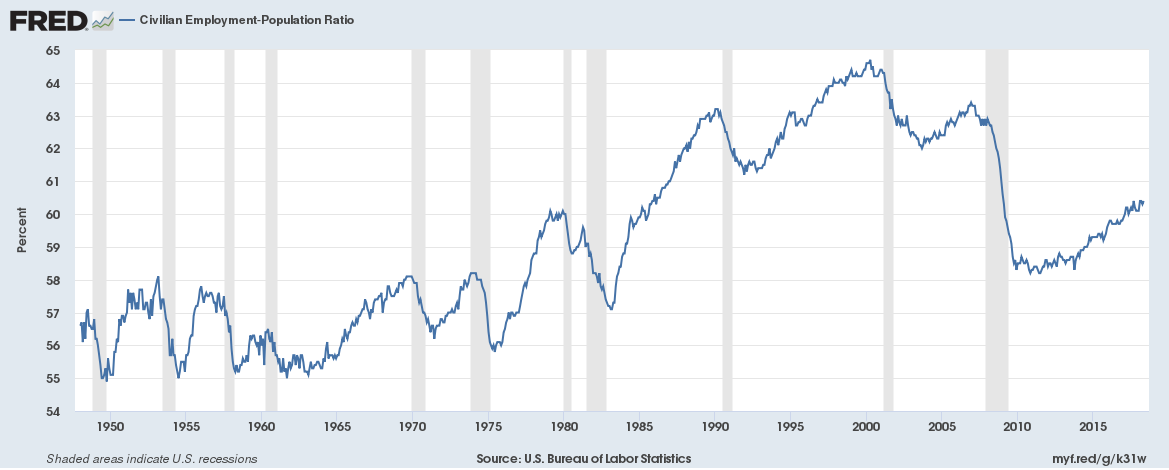
The rising employment/population ratio. People on the sidelines are seeing more people find jobs, which is what's pulling them into the labor market.
And finally, there are wages:
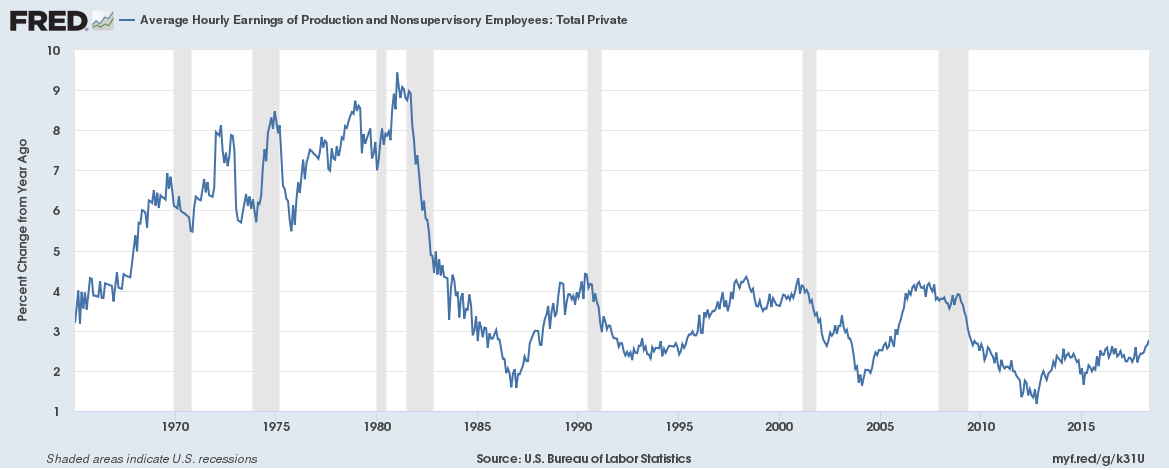
The good news is that the Y/Y percentage change in average hourly wages for non-supervisory employees is rising and is now 2.77%. The bad news is that the pace of gains is still very weak, especially for an unemployment rate of 3.8%.
All of this week's news was positive. Manufacturing is growing at a solid rate and the U.S. consumer continues to spend. Most importantly, the labor market is doing very well, especially for an economy that is this far into a recovery.
Disclosure: I/we have no positions in any stocks mentioned, and no plans to initiate any positions within the next 72 hours.
I wrote this article myself, and it expresses my own opinions. I am not receiving compensation for it (other than from Seeking Alpha). I have no business relationship with any company whose stock is mentioned in this article.
