
The US dollar traded lower against all the other major currencies, while equities kept drifting north, with Wall Street’s Dow Jones and S&P 500 hitting fresh record highs.
The catalyst behind the dollar slide may have been the slowdown in US consumer prices as it may have eased somewhat speculation over an earlier tapering by the Fed.
Tonight, Aussie traders may pay attention to Australia’s employment data, where a soft report could add credence to the RBA’s dovish stance.
USD Pulls Back As US Inflation Slows The Most In 15 Months
The US dollar pulled back against all the other major currencies on Wednesday and during the Asian session Thursday. The main gainers were NZD, AUD, GBP and JPY in that order, while the currency that eked out the least gains was CHF.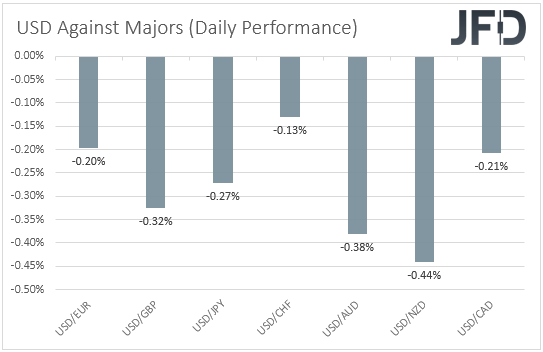
The weakening of the US dollar, combined with the strengthening of the risk-linked Kiwi and Aussie, suggests that markets traded in a risk-on manner yesterday and today in Asia. Indeed, looking at the performance of major global indices, we see that the EU ones were a sea of green, with the upbeat appetite rolling into the US session as well.
Although NASDAQ slid somewhat, both the Dow Jones and the S&P 500 climbed higher, hitting fresh record highs. That said, sentiment softened during the Asian session today, perhaps as fears over the fast spreading of the coronavirus in the continent remain elevated.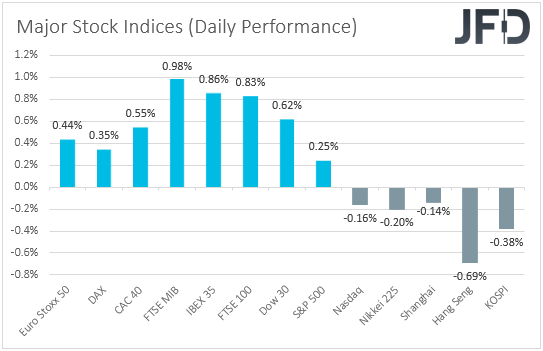
The catalyst behind the pause in the greenback’s latest uptrend, and the boost in the broader market sentiment, may have been the US CPIs for July, released yesterday. The headline yoy rate held steady at +5.4%, while the core one slid to +4.3% from +4.5%, as expected.
Looking at the details though, we see that on a mom basis, both headline and underlying inflation pressures slowed to +0.5% and +0.3%, both from +0.9%. This was the largest drop in the headline mom rate in 15 months and may have eased somewhat speculation over an imminent tapering and earlier rate hikes by the Fed, and that’s why the dollar slid. According to the Fed funds futures, the timing of the first rate increase was pushed back to March 2023 from February that year.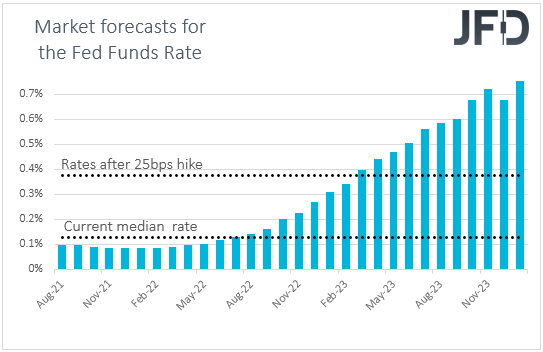
That said, our own view is that the data does not change the narrative much. Both the yoy rates are well above the Fed’s inflation target of 2%, and thus, it still remains to be seen whether the latest surge was indeed transitory. With that in mind, we would treat the greenback’s retreat as a corrective move rather than a reversal, and we would expect its prevailing uptrend to resume soon.
Focus will now turn to upcoming data and especially the next employment report. I think we would need to see a disappointment there for the tapering time to be pushed towards the end of the year or the beginning of the next. For now, we believe that officials are still willing to start the process in September or October.
As far as the equity market is concerned, we believe that it will continue to drift north, whatever market participants anticipate around the Fed. We saw Wall Street hitting records at times when normalization expectations were brought forth, perhaps as investors were rushing to take advantage low interest rates for as long as possible, but we also saw equities drifting north when such expectations were pushed back.
This may have been due to the fact that low interest rates for longer mean low borrowing costs for companies for longer, as well as lower present values for longer.
Tonight, during the Asian session Friday, Aussie traders may turn their gaze to Australia’s employment report for July. The unemployment rate is expected to have ticked up to 5.0% from 4.9%, while the net change in employment is forecast to show that the economy has added 30.0k jobs, slightly more than June’s 29.1k.
Although higher than June, this would still be a weak number, which combined with an uptick in the unemployment rate, is likely to keep the RBA dovish, and thereby, bring the Aussie under renewed selling interest, at least against currencies the central banks of which are expected to start normalizing their respective policies soon.
DAX- Technical Outlook
The German DAX cash index traded higher yesterday, overcoming the prior record of 15813, reached on July 13, and hitting a new one at 15890. Then, the index pulled back somewhat. Overall, the price has been in a short-term uptrend mode since July 19, which combined with the new record yesterday, paints a positive near-term outlook.
Although we could see a setback back below 15813, we would still see decent chances for the bulls to take charge again from near the 15720 zone, marked by yesterday’s low. This may allow a rebound back near the 15890 barrier, the break of which could pave the way towards the psychological round figure of 16000.
On the downside, the move that would force us to abandon the bullish case, at least for a while, is a dip below 15605, marked by the inside swing high of Aug. 3. This could initially open the path towards the 15510 barrier, which stopped the price from drifting lower on Aug. 2 and 3, the break of which could target the low of July 27, at 15416. Another break, below 15416, could see scope for extensions towards the 15300 area, defined as a support by the inside swing high of July 20.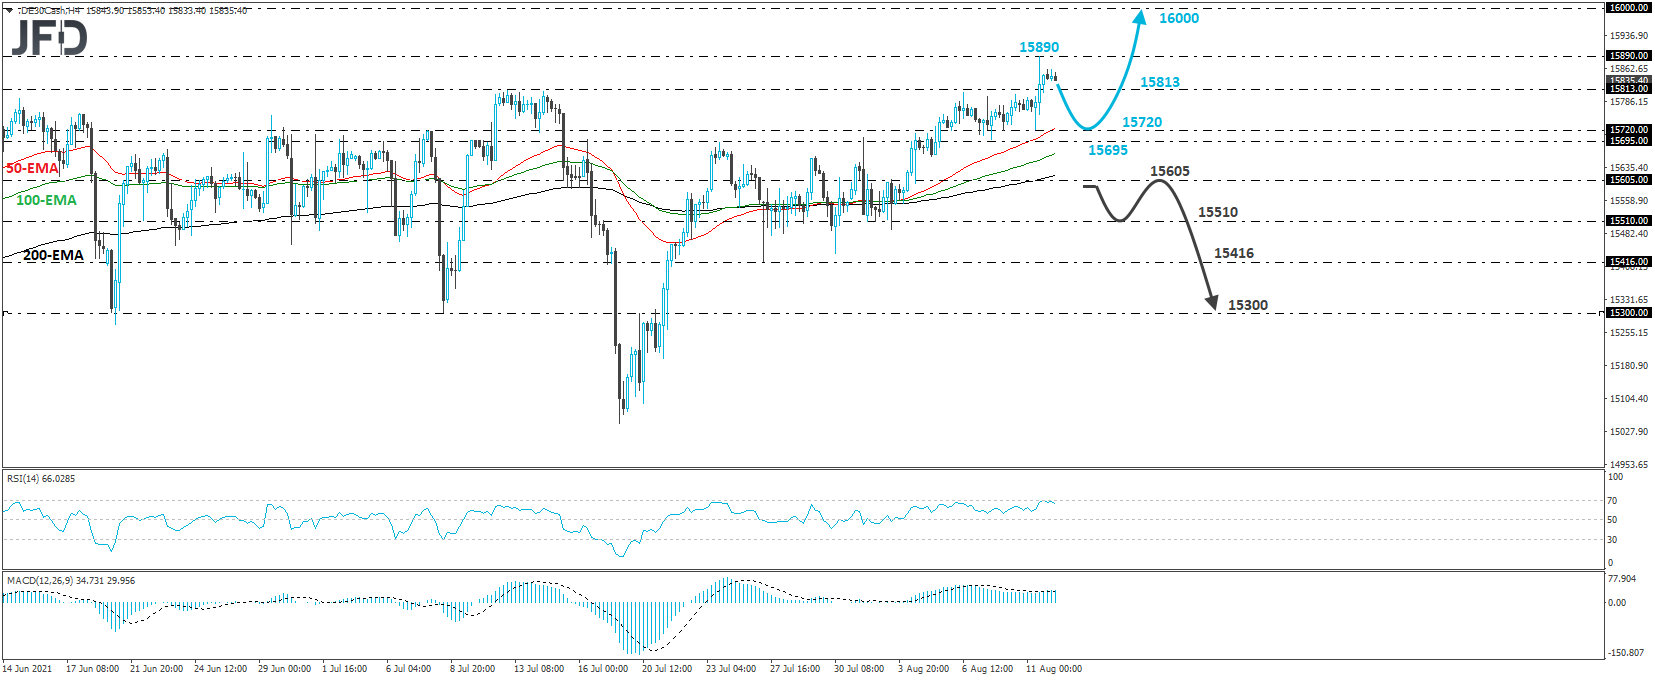
AUD/USD – Technical Outlook
AUD/USD edged up yesterday, after hitting support near the 0.7330 barrier, which is the lower end of the sideways range the pair has been trading within since July 21. The upper end is at 0.7415. As long as the rate stays in between those two boundaries, we will hold a flat stance.
However, bearing in mind that the prior trend of this pair was to the downside, and also taking into account the monetary policy divergence between the RBA and the Fed, we would see more chances for a downside exit out of the range rather than an upside one. A dip below 0.7330 may initially target the low of July 21, at around 0.7290, the break of which could trigger extensions towards the lows of Nov. 12 and 13, at around 0.7220.
On the upside, we would like to see a break, not only above 0.7415, but also above 0.7440, before we start examining the bullish case. This could confirm the upside exit out of the aforementioned sideways range and may pave the way towards the 0.7503 and 0.7534 zones, marked by the highs of July 13 and 7 respectively. If neither area is able to stop the advance, then we may experience extensions towards the peak of July 6 at 0.7600.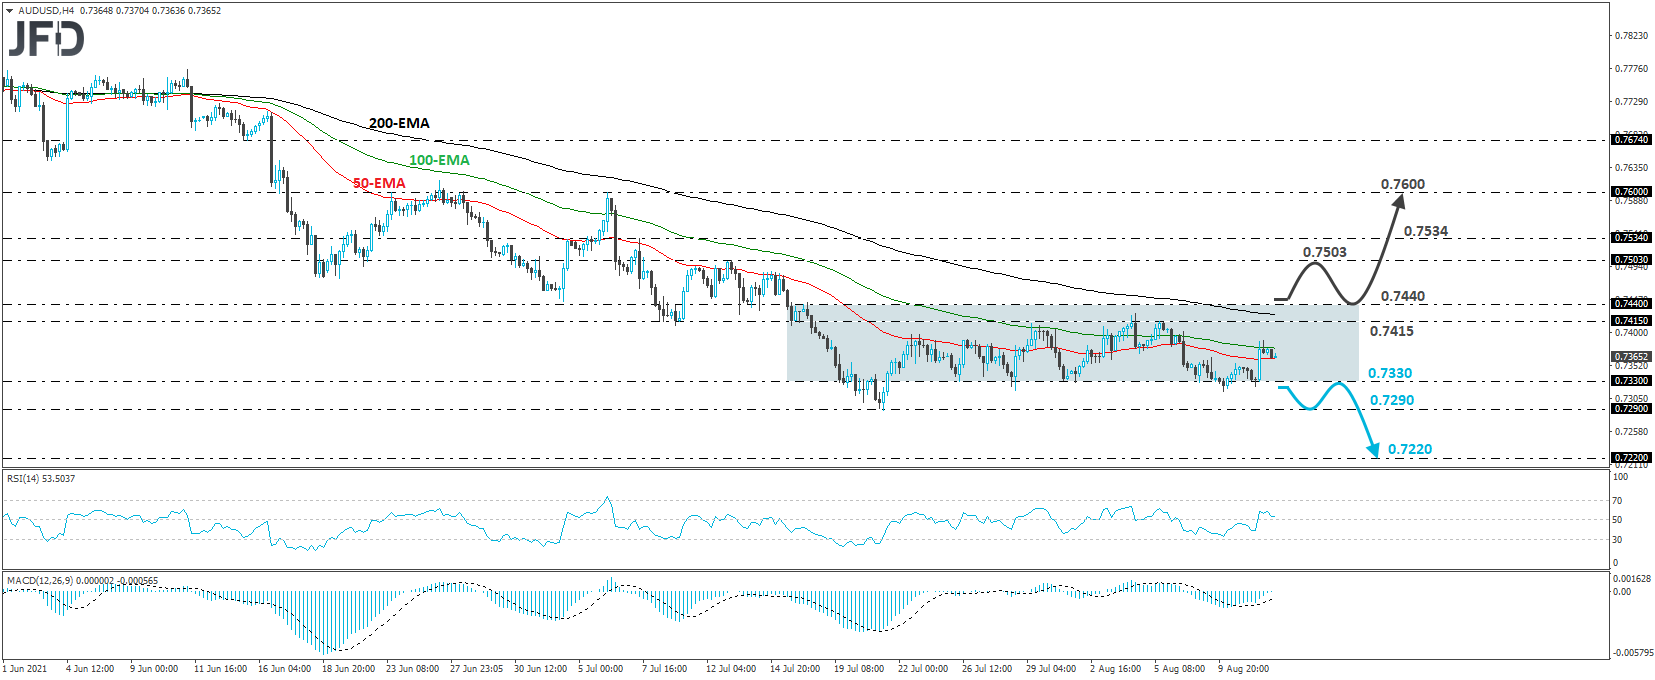
As For Today's Events
During the early European morning, we already got the preliminary UK GDP for Q2, which rebounded 4.8% qoq after contracting 1.6% in Q1, driving the yoy rate up to +22.2% from -6.1%. This may have added credence to the view that the BoE may start tapering its QE purchases earlier than previously anticipated.
From the US, we get the initial jobless claims for last week, which are forecast to have declined somewhat, to 375k from 385k.