
EU equities continued to slide yesterday, but Wall Street rebounded perhaps as investors regained confidence that a larger US fiscal stimulus will spur a faster economic recovery, and that vaccinations will eventually win the battle against the pandemic. As for today, we get the US CPIs for December, with the headline rate expected to have improved somewhat. However, we don’t expect this to alter expectations with regards to the Fed’s future plans.
US CPIs The Main Item On Today's Agenda
The US dollar reversed back south against all the other G10 currencies on Tuesday and during the Asian session Wednesday. It lost the most ground versus NOK, GBP, AUD, SEK, and NZD in that order, while it underperformed the least against CAD and EUR.
The weakening of the US dollar, combined with the strengthening of the risk-linked Aussie and Kiwi, suggests that markets traded in a risk-on fashion yesterday and today in Asia. That said, turning our gaze to the equity world, we see that major EU indices continued their Monday slide, with UK’s FTSE 100 falling the most, perhaps due to a strengthening pound after BoE Governor Andrew Bailey said that there were “lots of issues” with cutting interest rates below zero, and that such a move could hurt banks.
That said, market sentiment improved during the US session, with all three of Wall Street’s main indices closing in the green. Perhaps investors regained confidence that a larger fiscal stimulus in the US under a Biden Presidency will spur a faster economic recovery, and that vaccinations will eventually win the battle against the pandemic. The upbeat morale rolled over into the Asian session today as well. Although China’s Shanghai Composite slid 0.27%, Japan’s Nikkei 225, Hong Kong’s Hang Seng and South Korea’s KOSPI gained 1.04%, 0.08%, and 0.71% respectively.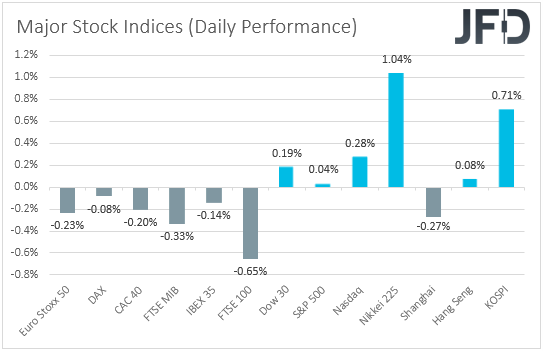
As for today, the main item on the agenda may be the US CPIs for December. The headline rate is forecast to have ticked up to +1.3% yoy from +1.2%, while the core one is anticipated to have held steady at +1.6% yoy.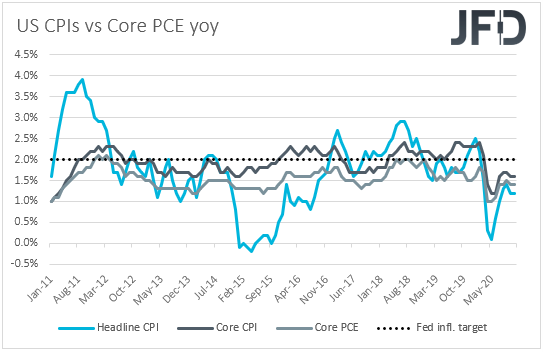
Last week, it was all about the runoff elections in the US state of Georgia, with Democrats winning both seats, something that sparked speculation for more fiscal stimulus and infrastructure spending in the US under Joe Biden’s Presidency. On top of that, on Friday, nonfarm payrolls for December fell 140k, recording their first drop since April, something that may have increased speculation for more monetary-policy support by the Fed in the months to come. Remember that the minutes from the latest FOMC gathering revealed that some members noted that they could consider further adjustments to their QE purchases, such as increasing the pace of purchases, or weighting them towards longer maturities.
In our view, a rising headline CPI is unlikely to decrease the chances for the Fed to expand its stimulative efforts. After all, the Committee wants inflation to rise above 2% for some time, so that it averages 2% over time. Thus, with both headline and core rates below the 2% mark, even an upside surprise may not be enough to change the dollar’s faith. Yes, the currency could rebound at the time of the release, but we don’t expect this to last for long. Eventually, it may come back under selling interest on hopes of more stimulus by the US government, as well as by the FOMC. Something like that may also help equities to continue trending north
USD/JPY Technical Outlook
Yesterday, we saw USD/JPY breaking its short-term tentative upside support line taken from the low of Jan. 6 and moving strongly to the downside. The pair slid below its 200 EMA on the 4-hour chart and remains below it. Even we if see a bit of retracement back up, as long as the 200 EMA continues to provide resistance, we will stick to the downside scenario.
A small push up could bring the rate back to the 103.75 hurdle, marked near the intraday swing lows of Jan. 7 and 8, or to the 200 EMA. If that whole area acts as a good resistance, this might lead to the pair sliding again. If so, USD/JPY could drift to the 103.52 zone, a break of which would confirm a forthcoming lower low. That’s when we will aim for the 103.44 obstacle, marked by the high of Jan. 6, or for the 103.25 territory, which is an intraday swing high of Jan. 7. If slide doesn’t stop there, the next possible target might be at 102.94, marked by an intraday swing low of Jan. 6.
In order to shift our attention to some higher areas, we would wait for a push above the 104.09 hurdle, marked by an intraday swing low of Jan. 12. This way we could start aiming for the 104.40 obstacle, a break of which may clear the way towards the 104.58 level, marked by the high of Dec. 10.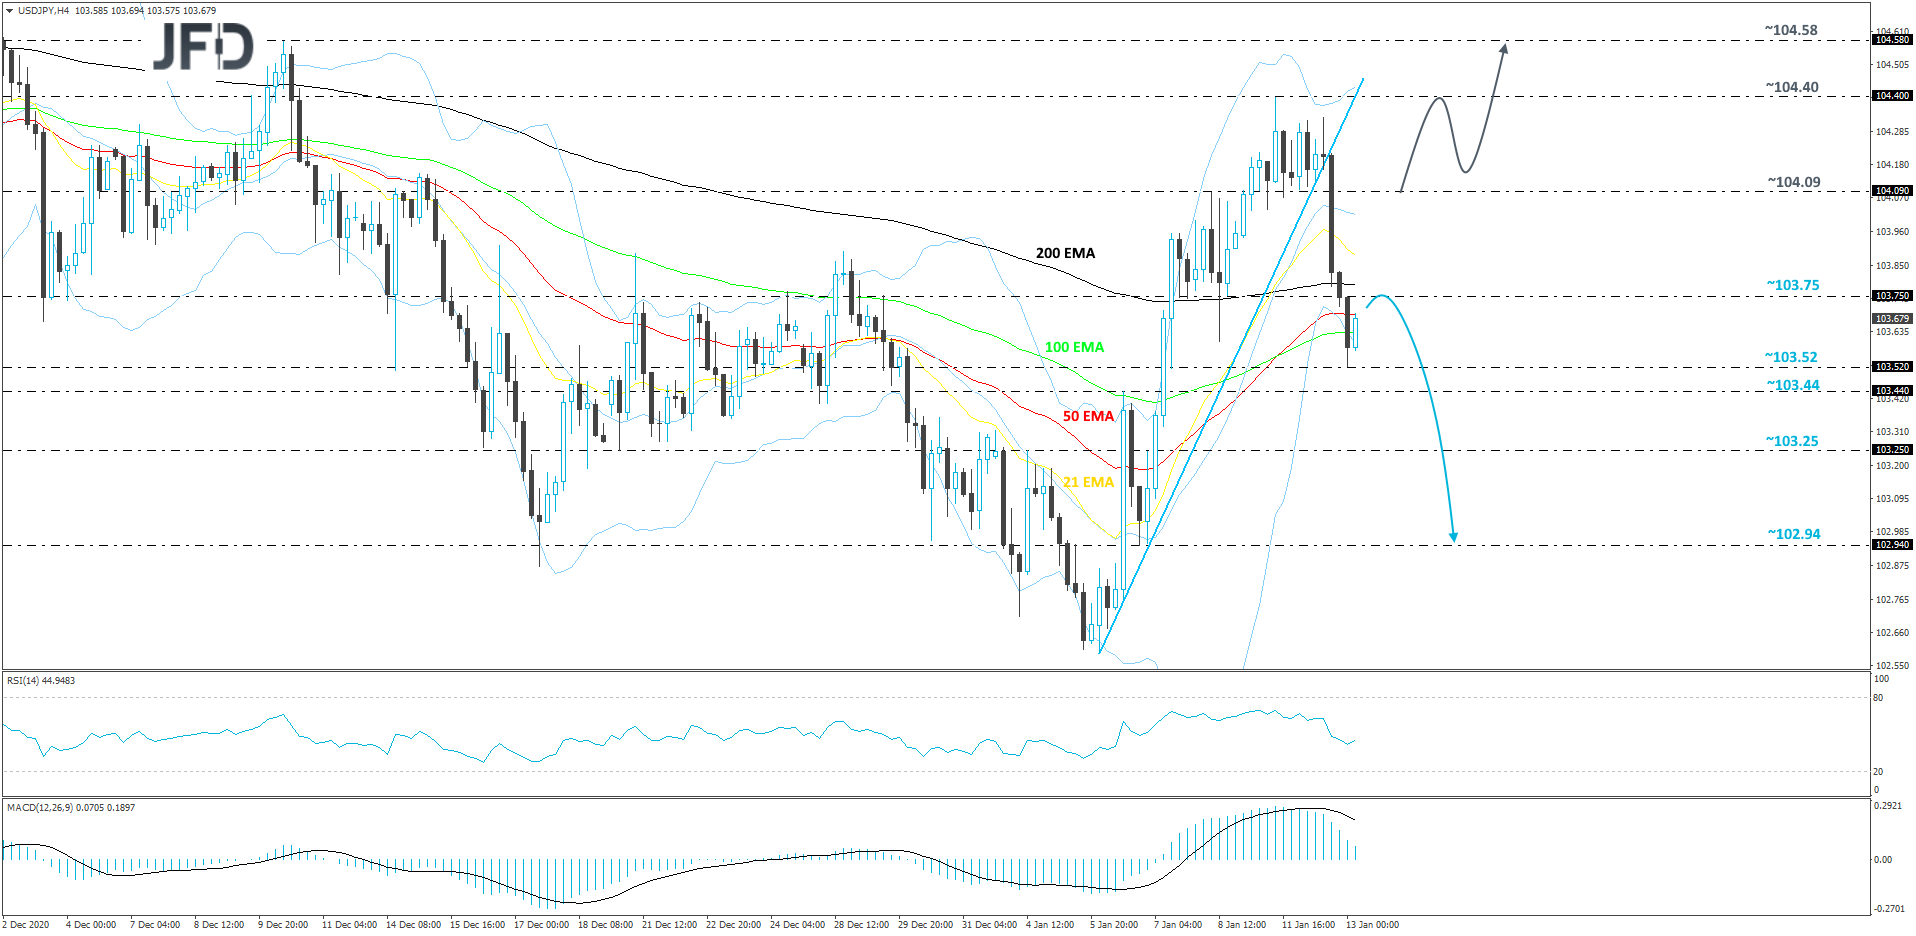
S&P 500 Technical Outlook
From the beginning of this week, the S&P 500 is trading slightly on the flat side, balancing near its 21 EMA on our 4-hour chart. At the same time, the index is still trading well above its short-term tentative upside support line drawn from the low of Dec. 21. We may see the price moving sideways, for now, but if it remains above the 3784 zone, marked by the high of Jan. 6 and the lows of Jan. 8 and 11, the index might end up moving to the upside again. Hence our somewhat positive approach for now.
As discussed in the previous paragraph, the S&P 500 could retrace slightly lower, but if it stays above the aforementioned 3784 territory, the buyers might take advantage of the lower price and push it north again. The index may then travel back to the 3831 area, which is currently the all-time high. A break of that area would confirm a forthcoming higher high and place the S&P 500 in the uncharted territory.
Alternatively, if the index slides heavily and falls below the 3776 zone, marked by yesterday’s low, that may lead to a larger correction lower. The S&P 500 might travel to the 3755 obstacle, or even to the 3741 hurdle, marked by an intraday swing low of Jan. 6. If the selling doesn’t stop there, the next potential level to consider for a possible support could be at 3723, which marks the lows of Dec. 29 and 31, and also intraday swing highs of Jan. 5 and 6. 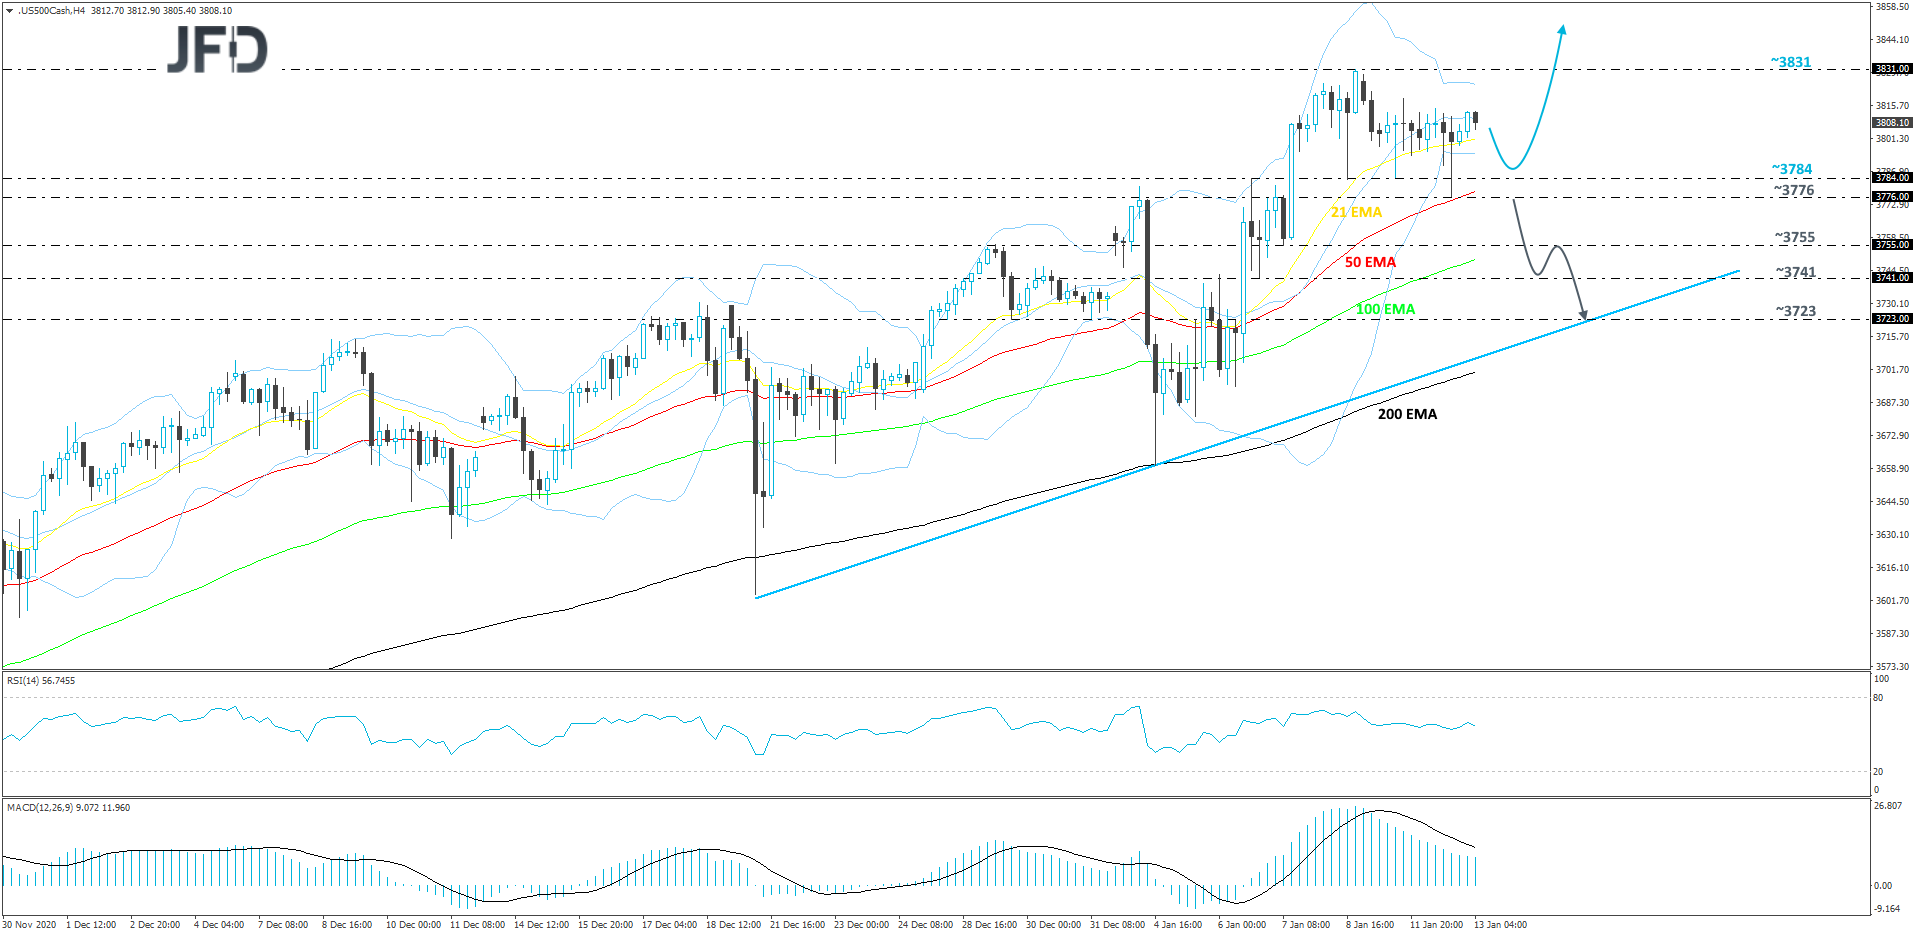
As For The Rest Of Today's Events
During the European morning, we get Eurozone’s industrial production for November, which is expected to have slowed to +0.2% mom from +2.1%.
Later, in the US, besides the CPIs, we also get the EIA (Energy Information Administration) report on crude oil inventories for last week. Expectations are for a 2.266mn barrels slide, following an 8.010mn fall the week before. However, bearing in mind that, yesterday, the API (American Petroleum Institute) reported a 5.821mn barrels decline, we would consider the risks surrounding the EIA release as tilted to the downside.
We also have five speakers on today’s agenda. Those are ECB President Christine Lagarde, Fed Vice Chair Richard Clarida, St. Louis Fed President James Bullard, Philadelphia Fed President Patrick Harker, and Fed Board Governor Lael Brainard.