Monday April 23: Five things the markets are talking about
US Treasuries begin the week on the back foot, trading atop of the key psychological +3% level at +2.994%, prolonging last week’s price decline as capital markets continue to evaluate the global outlook for trade and growth.
Note: Trade dominated discussions at an IMF gathering in Washington last weekend – the US/Sino trade row, coupled with global debt concerns, were named as threats to the global growth outlook.
Higher yields are supporting the US dollar against G7 currency pairs. Sterling had briefly been the exception, however, PM Theresa May is trying to squash a cabinet revolt.
Elsewhere, crude oil prices have eased a tad after rising for a second consecutive week on a commitment from OPEC to rebalance the market.
On tap for this week – the European Central Bank (April 26) and the Bank of Japan (April 27) meet and neither is expected to adjust their respective monetary policy.
Note: The market will be looking for any sign that EU officials are preparing a shift in stimulus plans for their June meeting.
Down-under, Japan releases its industrial production and employment data while the Aussie’s report their Q1 CPI data (April 23).
Stateside, the US releases its first estimate of Q1 GDP (April 27) and weekly jobless claims (April 26).
1. Stocks mixed start to the week
European shares are following their peers in Asia down.
In Japan, the Nikkei started the week in the ‘red’ as index heavyweight stocks lost ground, offsetting gains from financials, which rallied on higher sovereign yields. The Nikkei ended down -0.3%, while the broader TOPIX traded flat.
Down-under, Aussie shares rallied overnight, , with financials accounting for most of the gains, while materials rose on the back of firmer commodities prices. The S&P/ASX 200 index ended up +0.3%. In South Korea, the KOSPI traded little changed.
In Hong Kong, equities traded lower, led by tech stock on trade-spat worries. The Hang Seng fell -0.5%, while the China Enterprises Index lost -0.4%.
In China, major stock indexes ended Monday unchanged, although tech firms again were sold. The blue-chip CSI 300 ended up +0.2%, while the Shanghai Composite Index slipped -0.1%.
In Europe, regional indices trade lower across the board, following on from a weaker session in Asia and weaker US futures.
US stocks are set to open in the ‘red’ (-0.2%).
Indices: STOXX 600 -0.2% at 381.3, FTSE 100 flat at 7367, DAX -0.3% at 12503, CAC 40 -0.2% at 5401, IBEX 35 flat at 9887, FTSE MIB -0.1% at 23798, SMI -0.4% at 8773, S&P 500 Futures -0.2%

2. Oil dips as US drilling eases bullish sentiment, gold prices lower
Oil prices have eased a tad as a rising US rig count suggests a further increase in production.
Brent crude futures are at +$73.91 per barrel, down -15c, or -0.2% from Friday’s close. US West Texas Intermediate (WTI) crude futures are down -18c, or -0.3% at +$68.22 a barrel.
Note: Brent is up by +20% from this year’s February low.
Baker Hughes data Friday showed that US drillers added five rigs drilling for new production in the week ended April 20, bringing the total to +820, the highest in three years. The rising rig numbers point to further increases in US crude production, which is already up +25% in two-years to a record +10.54m bps.
Note: Only Russia produces more, at almost +11m bpd.
Prices are also being supported by supply cuts led by the OPEC to prop up the market.
Ahead of the US open, gold prices slip to a new two-week low as rising bond yields support the dollar. Spot gold is down about -0.1% at +$1,334.11 per ounce, after earlier touching its lowest since April 10 at +$1,331.70. US gold futures fell -0.2% to +$1,336.30 per ounce.

3. Sovereign yields back up
The US 10-year Treasury yields are within touching distance of the key psychological +3% handle.
Higher US yields are also supporting many regional yields. Germany’s 10-year Bund yield has climbed +4 bps to +0.63%, the highest in six-weeks, while the UK’s 10-year Gilt yield has backed up +4 bps to +1.518%.
Note: The last time yields traded atop of current yield levels it hurt investor risk appetite and sent equities tumbling. It also came shortly before crude oil prices plummeted -75%.
The European Central Bank (ECB) guidance later this week (April 26), about the future of its stimulus programme, is the next thing that may cause some yield movement.
Last Friday, ECB’s Draghi said he was confident that the inflation outlook has picked up, but uncertainties “warrant patience, persistence and prudence.”

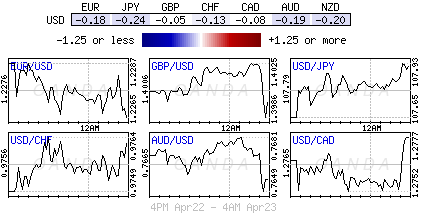
4. Dollars firm hand
Higher yields are supporting the ‘big’ dollar across the board. However, if the rise in US yields is “not” sustained and if market talk becomes one of concern about US debt levels, then this recent dollar bounce higher may not be sustainable.
The EUR/USD is down -0.4% at €1.2236 and US 10-year Treasury yields are at +2.9944%. Dollar ‘bulls’ argue that if US 10’s yields were to break above 3% and stay there, and if volatility were to remain low, avoiding a sell-off in risk assets, the EUR is likely to trade beck towards the key support level at €1.2150.
Higher US yields could generate some problems for the most vulnerable in the emerging market space.
GBP/USD has moved below the £1.40 level to £1.3960. Market focus for the pound will shift to the House of Commons debate later this week (April 26) on the Withdrawal Bill. Sterling is also under pressure on rumours that PM May maybe forced to accept staying in the EU’s customs union.
Note: On Apr 18 PM May’s government suffered defeat on the EU Withdrawal Bill in the House of Lords
USD/JPY (¥108.23) rise is aided by the rise of the US yields. Japanese officials noted that Finance Minister Aso and US Treasury Sec Mnuchin did not discuss exchange rate moves at a bilateral meeting last Friday. The BoJ meets on Friday will update its forecasts and include fiscal year 2020 for the first time.
Note: There has been speculation that the BoJ might have to cut its inflation forecasts this week but maintain its timeline in achieving the 2% inflation target in the next fiscal year.

5. Eurozone private sector growth steady in April
Data this morning showed that EU activity in private sector grew at a steady pace this month after two straight months of easing. This may suggest that a Q1 slowdown may be coming to an end.
EU Purchasing Managers Index (PMI) was unchanged at 55.2 in April from March. The market had expected to see a decline to 54.8.
Digging deeper, today’s report continues to record some worrying developments. While activity in the services sector picked up, the more export-oriented manufacturing sector continued to slow. This may be due to the EUR’s appreciation against most currencies in the past 12-months.
On Friday, ECB’s Draghi warned that the eurozone’s growth cycle may have peaked, and suggested that the ECB would move only slowly to phase out QE.