The US dollar was trading mixed yesterday, and there was some weakness as the latest durable goods orders data showed a 1.1% decline, which was more than expected. Core durable goods orders rose 0.1%, slower than the estimated 0.4% increase. The decline in the headline durable goods orders was the biggest drop in nearly 9-months.
Gold prices posted a sharp decline yesterday, falling to intraday lows of $1235.99 before stabilizing. The decline in gold prices was attributed to an erroneous sell order which pushed gold prices lower.
The economic calendar today is packed with speeches from various central bank officials. This includes ECB President Mario Draghi, BoE Governor, Mark Carney and later in the day, FOMC members Harker and Kashkari along with the Fed Chair Janet Yellen are expected to speak.
EUR/USD intraday analysis

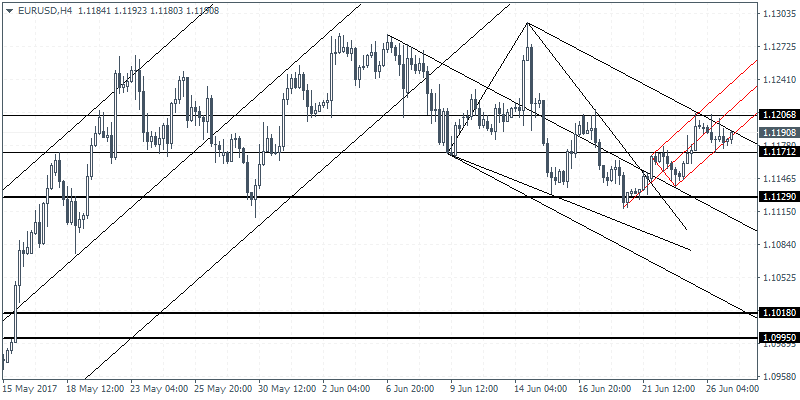
EUR/USD (1.1180):The EUR/USD was rather muted with price action staying firmly above the 1.1129 support level. The strong intraday consolidation seen above this level and 1.1200 is indicative of a possible breakout in the near term. Above 1.1200, further gains could be expected, but the risk of rising past 1.1200 could signal a move towards the support level at 1.1129, followed by a decline to 1.1018. EUR/USD is currently carving out the head and shoulders pattern with the neckline support at 1.1129 that will be key. The current gains in prices could form the right shoulder following which we could expect some strong declines.
GBP/USD intraday analysis

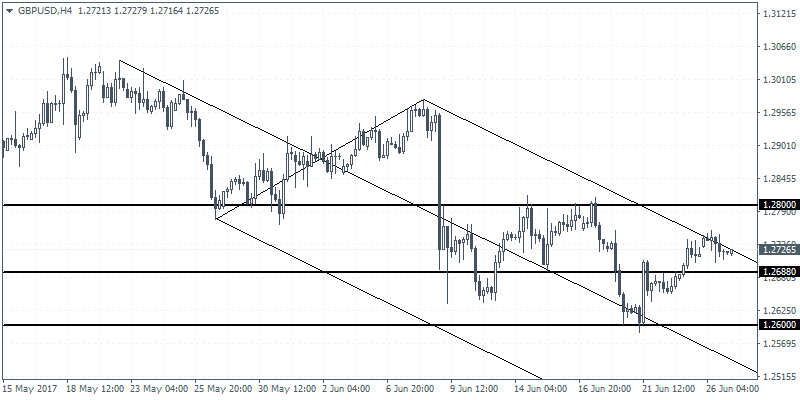
GBP/USD (1.2726):The British pound closed with a doji candlestick pattern yesterday following the strong rally off the 1.2600 support level. Resistance is seen at 1.2800 - 1.2780 which could be tested in the near term. Failure to break past this resistance level could put GBP/USD back on track for near-term losses. On the 4-hour chart, if we expect to see a rally in prices, then GBP/USD could be seen pushing lower near 1.2800. The evolving inverse head and shoulders pattern here suggests some near-term upside in prices. Watch for a reversal near 1.2688 after establishing resistance at 1.2800. This would mark the right shoulder in GBP/USD with the minimum upside target coming in at 1.3200 at the very least.
USD/JPY intraday analysis

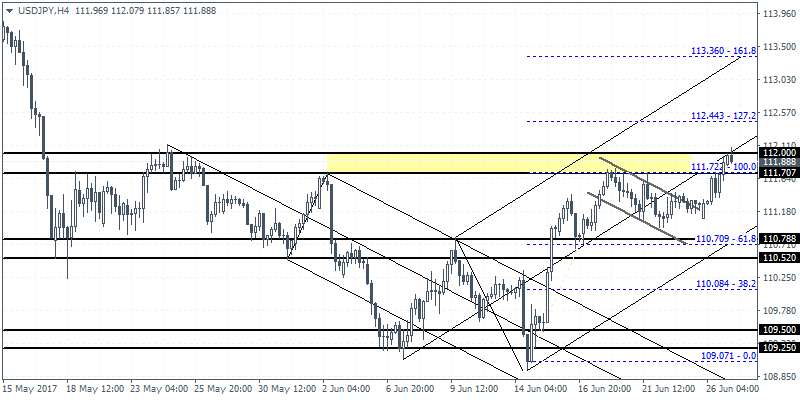
USD/JPY (111.88):The USD/JPY managed to break past the resistance level at 111.61 by yesterday's close. However, the price action is not very convincing at this resistance level, and this could probably result in some near-term declines. On the 4-hour chart, USD/JPY is trading within the resistance zone of 112.00 - 111.70 following the bullish break out from the flag pattern. Near-term declines could be held at 111.70, but a break down below this level could invalidate the bull flag pattern. The next lower support is seen at 110.70.
