
Equities and other risk-linked assets pulled back yesterday and today in Asia, while the US dollar rebounded as bond yields surged once again after a disappointing auction of 7-year US notes. This suggests that despite Fed Chair Powell’s dovish remarks on Tuesday and Wednesday, investors remained worried that the economic recovery will lead to high inflation.
Bond Yields Rally Again, Pushing Equities And Other Risk-Linked Assets Down
The US dollar traded higher against all but one of the other G10 currencies on Thursday and during the Asian session Friday. It gained the most versus NOK, AUD, GBP, and NZD in that order, while it eked out the least gains against JPY and EUR. The greenback was found virtually unchanged versus CHF.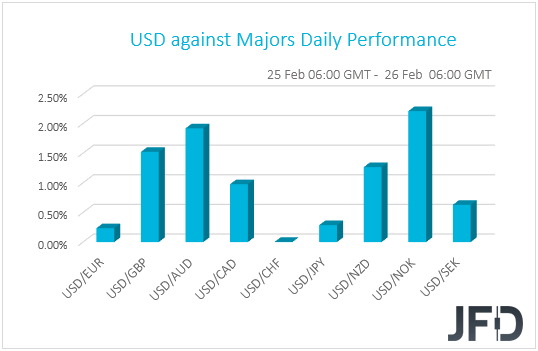
The relative strength of the safe-havens franc and yen and the weakening of the risk-linked Aussie and Kiwi suggest that markets turned risk-off again yesterday and today in Asia. Indeed, turning our gaze to the equity world, we see that most major EU indices closed slightly in the negative territory, with risk aversion intensifying during the US and Asian sessions.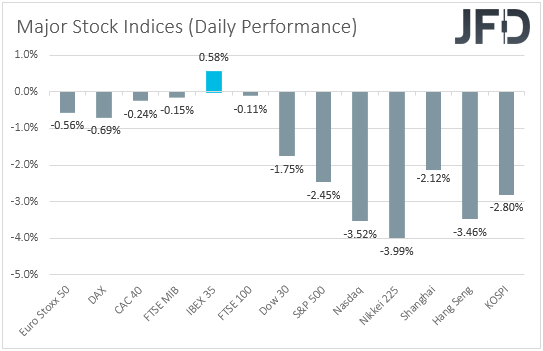
The driver behind the rebound in equities was once again rising bond yields due to heightening inflation expectations. It is worth noting that the bond sell-off accelerated after a disappointing auction of 7-year US notes, with the 10-year yield surging more than 20bps to hit a fresh one-year high above 1.6%. All this suggests that despite Fed Chair Powell’s reassurance that he and his colleagues will keep monetary policy accommodative until there is substantial improvement towards their employment and inflation goals, market participants remained unconvinced and still worried that the economic recovery will lead to high inflation.
Recently, we’ve been highlighting that the unprecedented government and monetary policy stimulus, combined with the increasing covid vaccinations, may allow equities to trend north and safe havens to stay under selling interest on expectations that the global economic recovery is on track. It now seems we’ve reached a point where the same catalysts have a different market effect. Yes, investors still believe to a strong economic rebound, but they are now afraid that this would lead to higher inflation.
In any case, we still believe that the slide in equities and other risk-linked assets will prove to be a corrective phase, and the reason is that the Fed has noted that they will not tighten policy even if inflation overshoots 2% in the months to come. They clearly said that they expect such a spike to be temporary and that inflation will rise and stay above 2% for some time—the goal for the beginning of normalization—in the years after 2023. As a result, we expect fears over high inflation to ease in the foreseeable future, which may allow equities and other risk-linked assets to rebound. As for the dollar, it may come under selling interest on more signs that the Fed is likely to stay accommodative for longer than previously assumed.
DAX Technical Outlook
DAX took a deep dive yesterday, as markets turned to risk-off trading. Given the current weakness, we might see more downside in the near-term, however, let’s not forget that the index is still trading above a short-term tentative upside support line drawn from the low of Dec. 21. If that line stays intact, a rebound could be possible. For now, we will remain cautiously bullish with the near-term outlook.
A fall below the 13661 hurdle, marked by the low of Feb. 23, could lead the index to the aforementioned upside line, which if holds, might help the bulls get back into the game. If so, DAX may rise back to the 13661 zone, or to the 13826 area, marked by the inside swing low of Feb. 10. If the buying doesn’t stop there, the next possible target could be the short-term tentative downside resistance line, taken from the high of Feb. 8, which might slow down the acceleration.
On the other hand, if the previously discussed upside line breaks and the index falls below the 13366 hurdle, marked by the high of Dec. 10 and the low of Jan. 29, that may spook the remaining bulls from the field. Such a move might clear the path towards the 13260 zone, marked by the lowest point of February, where the index could stall for a bit. That said, if the bears are still strong, they may force DAX to move further south, possibly targeting the 13045 obstacle, or the 13006 level, marked by the lows of Dec. 21 and 11 respectively.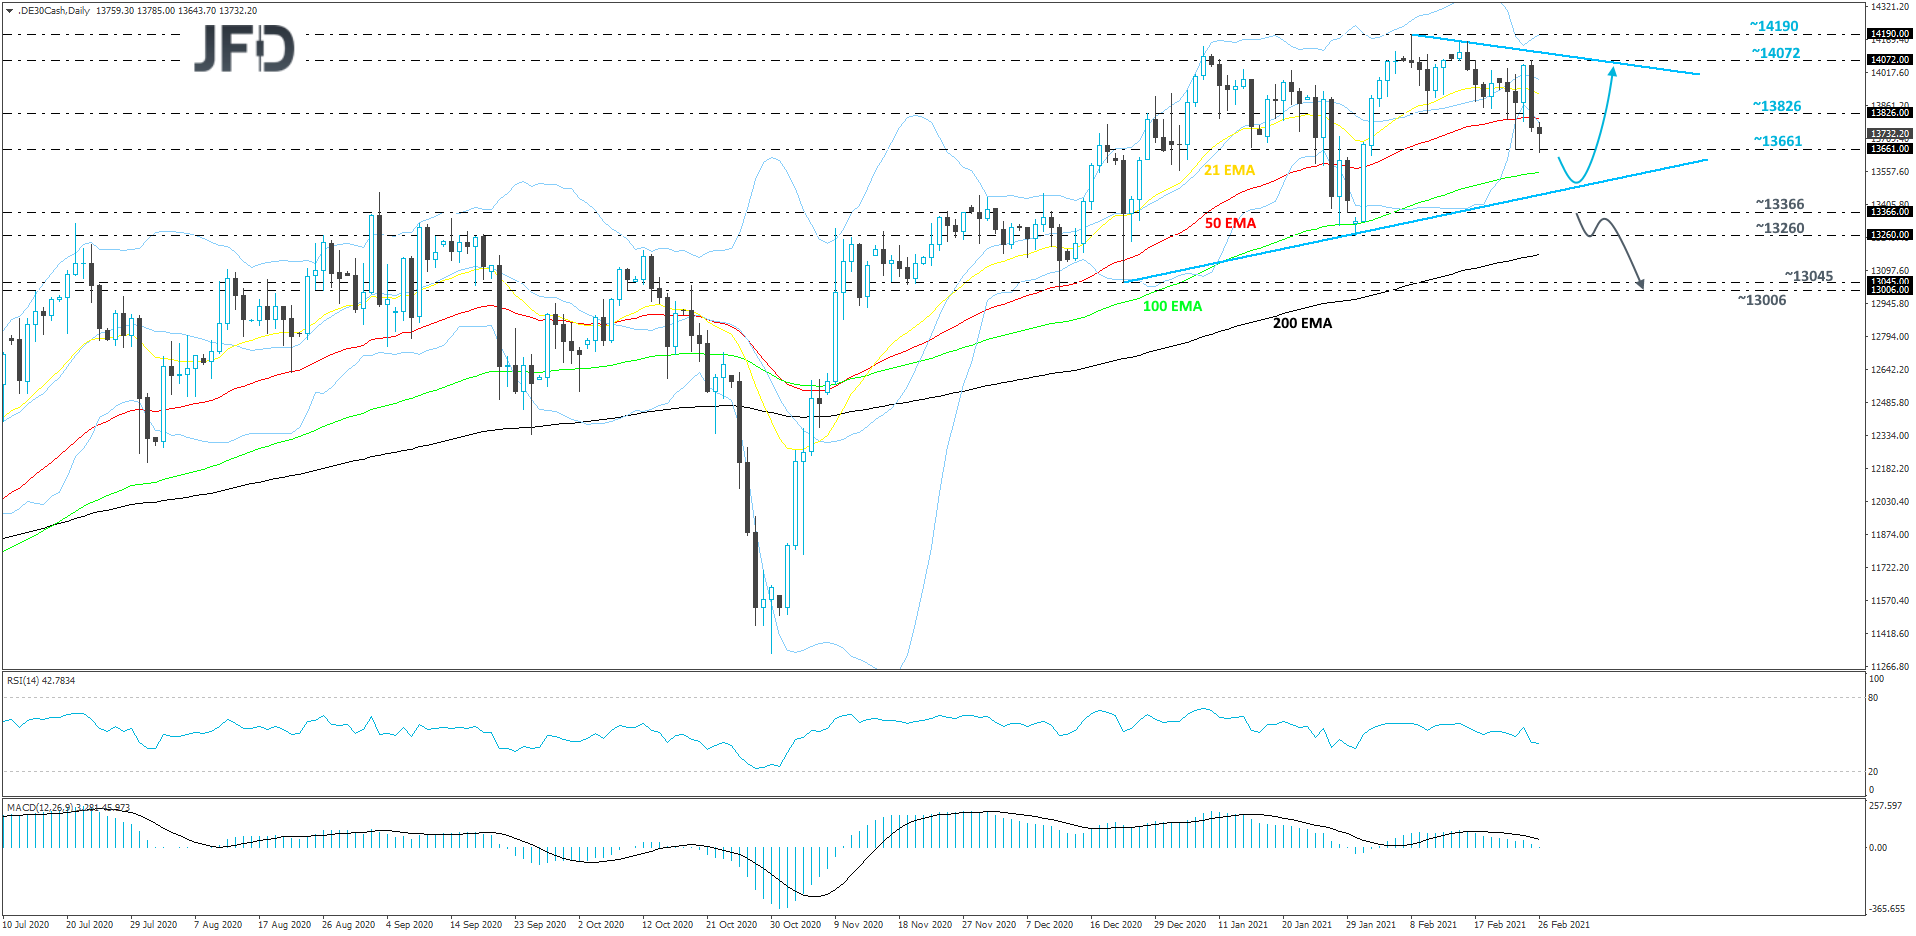
EUR/USD Technical Outlook
Overall, EUR/USD continues to trade above a medium-term tentative upside support line drawn from the low of Nov. 4. This week, the bulls made a few attempts to send the pair higher, but each time the bears were pushing the rate back below the 1.2170 hurdle, marked near the highs of Jan. 27 and Feb. 16. Currently, EUR/USD is trading below it and there is good chance we may see a larger correction lower, before another possible move higher. That is, of course, if the above-mentioned upside line holds. We will take a cautiously-bullish stance for now.
If the rate ends up correcting lower, it could reach Wednesday’s low, at 1.2109, or it might end up testing the aforementioned upside line. If that line is able to continue providing support, the bulls may take advantage of the lower rate and push it back up, possibly even targeting the 1.2170 barrier again. If this time EUR/USD can overcome that obstacle and remain above it, that’s when more buyers might join in. The pair could then drift to the 1.2222 zone, or to the 1.2242 level, marked by the current highest point of this week.
Alternatively, if the previously mentioned upside line breaks and the pair falls below the low of Feb. 17, at 1.2023, that could open the way to the lowest point of February, at 1.1952, where the rate might stall for a bit. However, if the bears are still feeling comfortable, they may continue applying pressure, potentially forcing the 1.1952 hurdle to surrender. This way EUR/USD could slide to the 1.1885 level, marked near the high of Nov. 19 and the low of Nov. 26.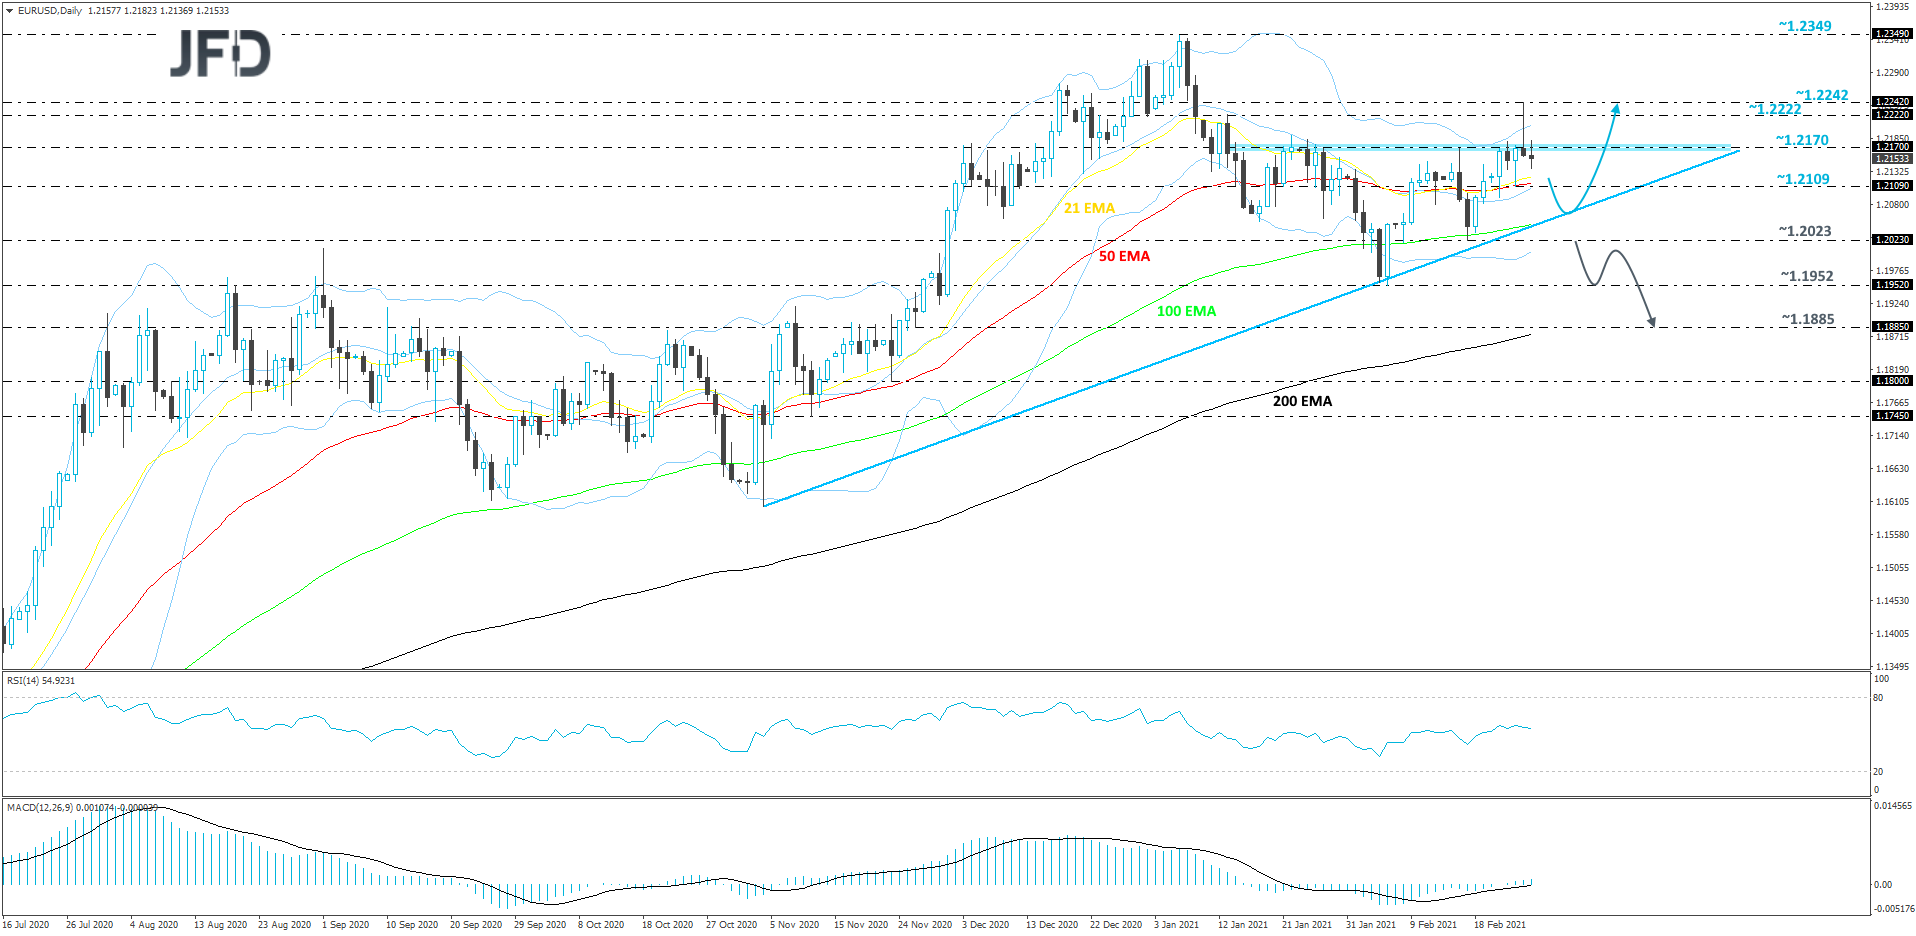
As For Today's Events
During the US session, we get personal income and spending data for January, alongside the core PCE index for the month. Personal income is expected to have surged 9.9% mom after rising 0.6% in December, while spending is anticipated to have rebounded 2.5% mom after sliding 0.2%. The core PCE index is expected to have ticked down to +1.4% yoy from +1.5%.
A slide in this inflation metric, which is the Fed’s favorite one, may ease somewhat concerns over high inflation and thereby allow the equities to rebound. At the same time, the US dollar may pull back. The final UoM consumer sentiment index for February is also coming out and the forecast is for a small upside revision to 76.5 from 76.2.
As for the speakers, we have three on today’s agenda: BoE Chief Economist Andy Haldane, BoE Deputy Governor for Markets and Banking Dave Ramsden, and ECB Executive Board member Isabel Schnabel.