The U.S. dollar was seen strengthening for a second day fueled by the optimism from the tax cuts. The dollar maintained gains despite the ISM's non-manufacturing PMI coming out weaker than expected. Non-manufacturing activity was seen falling to 57.4 in November which was below forecasts and weaker than October's print.
Earlier today, the Australian quarterly GDP data showed that the economy posted a growth rate of 0.6% on the quarter. This was below forecasts of a 0.7% increase. The second quarter GDP was revised higher to show a 0.9% increase.
Looking ahead, German factory orders and Swiss inflation data will be released. The NY trading session will see the release of the ADP private payroll numbers. Forecasts point to a 189k headline print.
The Bank of Canada will be holding its monetary policy decision later today. No changes are expected as the central bank is seen keeping rates steady at 1.0%. The central bank was seen hiking rates twice this year.
EUR/USD intra-day analysis

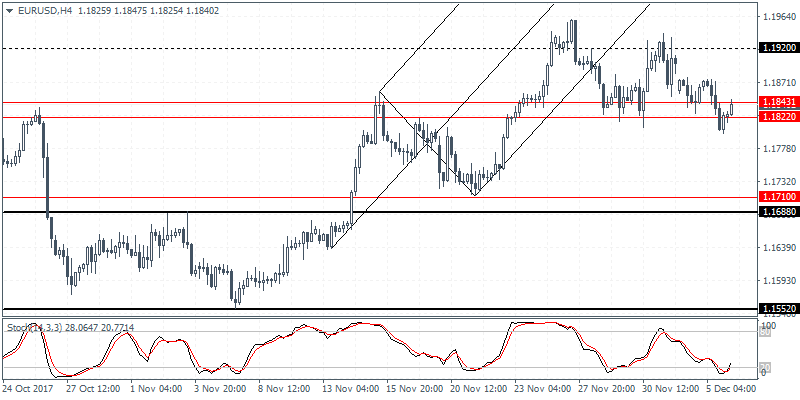
EUR/USD (1.1840): The EUR/USD closed on a bearish note yesterday as price action formed a bearish engulfing pattern on the daily session. The gradual decline could see further downside momentum building up ahead of this Friday's nonfarm payrolls report. After briefly slipping below 1.1822, the euro currency managed to rebound to trade back in the support zone of 1.1843 and 1.1822. However, we expect this rebound to be short lived. Failure to close above the support zone could pave way for EUR/USD to post declines to the next lower support seen at 1.1710 - 1.1688.
USD/JPY intra-day analysis

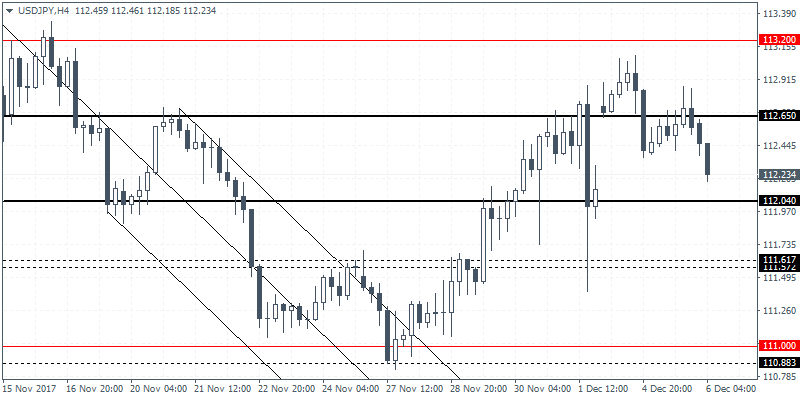
USD/JPY (112.23): The USD/JPY attempted to push higher but price action closed with an inside bar on the daily session. The current downside breakout could signal a near term decline if the U.S. dollar manages to close bearish. In the short term, the currency pair could be seen falling back to 112.04 level of support. This marks a retest of the support level while also filling the gap from Monday's open. The overall bias remains flat as we expect USD/JPY to remain supported near 112.04. A breakout from the 112.65 and 112.04 region will potentially pave way for further gains or declines.
XAU/USD intra-day analysis

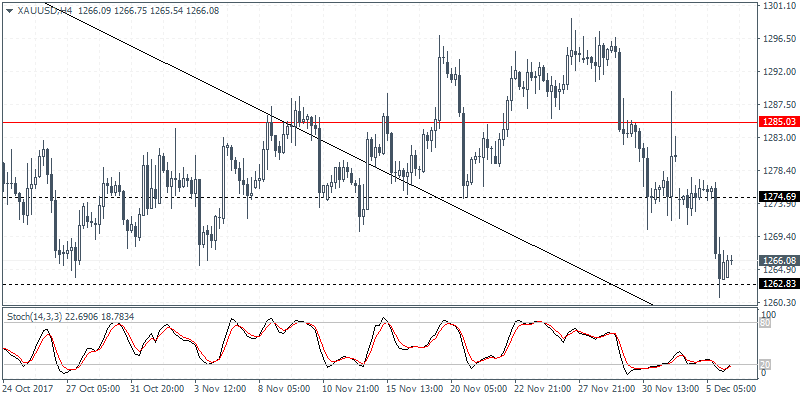
XAU/USD (1266.08): Gold prices extended the declines as price action fell to the 1262 level of support as noted in yesterday's commentary. With price action retesting this support level, the daily chart shows a potential descending triangle pattern shaping up. A break down below 1262 could signal further declines in the precious metal. Alternately, if gold prices manage to rebound off the support, the gains are limited to the 1274.70 level of resistance.
