Tuesday July 24: Five things the markets are talking about
Overnight, Euro bourses along with U.S equity futures have edged a tad higher on the back of a plethora of positive corporate earnings boosting investor sentiment.
Also, China’s determination to support the world’s second largest economy has helped to support various risk assets in the Asia session overnight. Is there another cut to its reserve-requirement ratios (RRR) coming? China needs to shore up economic growth in the face of an actual trade war.
In FX, the EUR (€1.1695) is little changed, supported by German data showing that they have so far resisted worries over disruption to trade. In China, the People’s Bank of China (PBoC) guided the Yuan to new 12-month lows.
U.S Treasuries have backed up a tad along with Euro sovereign bonds.
Elsewhere, crude oil prices trade atop of its recent lows, while gold prices are steady.
On tap: As the week continues, more corporate earnings come on line, while the ECB’s monetary policy will be the markets focus on Thursday. On Friday, Trump and his economic team are increasingly convinced the GDP numbers will be strong – he expects Q2 GDP to rise to as much as +4.8%!
1. Stocks see the light
Shares in Asia rallied on news China will increase spending on infrastructure among other measures to bolster growth.
In Japan, the Nikkei share average bounced overnight, reducing Monday’s losses as the yen’s (¥111.23) rally stalled exporters. The Nikkei ended the day up +0.51%. The index had fallen -1.3% the previous session as the yen soared outright. The broader Topix rallied +0.47%.
Down-under, Aussie shares rallied on Tuesday as firmer commodity prices supported material stocks, while financials followed its Wall Street peers. The S&P/ASX 200 index rose +0.6% at the close of trade. The benchmark fell -0.9% on Monday. In S. Korea, the KOSPI stock index rose overnight, up +0.48%, in line with its Asian peers, while the won tumbled ahead of Friday’s U.S advanced GDP growth.
Note: South Korea’s Kospi has experienced the weakest H1 in five-years – down -5.7%.
In China, government bond yields and equities rallied overnight after authorities promised to pursue a more ‘vigorous’ fiscal policy, in an effort to support growth amid rising economic headwinds. The blue-chip CSI 300 index rose +0.9% while the Shanghai Composite Index ended up +1.1%. In Hong Kong, the Hang Sang index rose +1.44%, while the China Enterprises Index gained +0.5%.
In Europe, regional indices trade higher across the board, supported by generally strong manufacturing PMI data and upbeat earnings from European names.
U.S stocks are set to open in the ‘black’ (+0.2%).
Indices: STOXX 600 +0.9% at 388.2, FTSE +0.7% at 7710, DAX +1.4% at 12718, CAC 40 +0.9% at 5424, IBEX 35 +0.7% at 9794, FTSE MIB +1.1% at 21,893,SMI +0.4% at 8992, S&P 500 Futures +0.2%

2. Oil is steady as U.S/Iran row balances trade worries, gold lower
Oil prices remain little changed as rising tension between the U.S and Iran highlight potential risks to supply, while escalating trade disputes raised the prospect of slower economic growth and perhaps weaker energy demand.
Brent crude oil is unchanged at +$73.06 a barrel, while U.S light crude is up +15c at +$68.04.
Note: Both benchmarks have fallen this month as crude supplies from Russia, Saudi Arabia and other members of the OPEC have increased and unscheduled production losses have eased.
To date, market sentiment remains driven by geopolitical worries in the Middle East or that Trump’s trade dispute with G7 economies could dampen global growth.
Note: Iran, OPEC’s third-largest producer is pumping +3.75M bpd, has come under increasing U.S pressure, with President Trump pushing countries to cut all imports of Iranian oil from November.
Ahead of the U.S open, gold prices have edged down overnight on a firmer dollar and a rise in U.S Treasury yields and as the markets reaction to the dispute between the U.S and Iran remains somewhat muted. Spot gold is down -0.3% at +$1,220.27 an ounce, while U.S gold futures for August delivery are -0.4% lower at +$1,220.20 an ounce.

3. Sovereign yields continue to back up
The Nikkei has suggested that politics could be a factor at the BoJ upcoming July 31 policy decision. It suggests that political considerations could pressure the central bank to take action at the July meeting, as a policy decision at the September meeting could influence the LDP leadership elections.
It also notes that Japan has regional elections in April 2019, while in October of 2019 the consumption tax is expected to rise to +10% from +8% – consensus believes the further you look out the ‘curve’ the more difficult it will be to make changes to policy.
In Canada, sovereign bond prices fell yesterday after positive economic data weakened the markets demand for the safety of government debt. Yields on the 10-YearTreasury note were recently at +2.22% after it was reported that Canadian wholesale trade rose +1.2% m/m in May.
Note: Last Friday saw better than expected Canadian data – annual inflation had reached a new six-year high, boosting market expectations for another rate increase from the BoC this year.
Elsewhere, the yield on US 10-Year notes have gained +1 bps to +2.96%, the highest in almost six-weeks. In Germany, the 10-Year Bund yield rallied +1 bps to +0.42%, the highest in almost five-weeks. In the U.K, the UK 10-Year Gilt yield climbed +3 bps to +1.298%, the highest in two-weeks.

4. China fixes yuan at fresh one-year low
Overnight, the U.S. dollar has regained some strength, boosted by rallying Treasury yields.
Elsewhere, Chinese officials guided the yuan -0.4% weaker outright, fixing the Chinese currency at a fresh one-year low. The PBoC set the dollar’s midpoint for daily trading at ¥6.7891, compared with ¥6.7593 Monday. The ‘mighty’ dollar ended onshore trading yesterday at ¥6.7834.
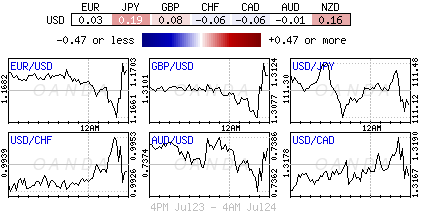
EUR/USD (€1.1685) has reversed some of its initial losses in the Euro session as the major PMI manufacturing data beat expectations. The Euro upside has been limited in the belief that the ECB is on hold regardless of any incoming data.
USD/JPY (¥111.23) is holding above the psychological ¥111 handle as the market debates the prospect of a possible tweaking the BoJ’s policy on July 31.
GBP/USD (£1.3109) trades atop of its recent lows as BoE member, Anthony Broadbent, stated that he was not sure if whether he would vote for rate hike next month.

5. German growth strongest since February
July data saw a further pick-up in the rate of growth of Germany’s private sector economy from a 20-month low in May to a five-month high, driven by a stronger increase in manufacturing output.
The IHS Markit Flash Germany Composite Output Index rose to 55.2 in July from 54.8 in June, to signal a second successive monthly acceleration in the rate of growth in private sector business activity.
Digging deeper, new order growth also gathered pace, while private firms continued to add staff and price pressures intensified.
Note: By sector, services business activity increased at a solid rate that was little changed from June, while manufacturing output growth was the fastest since April.