Ahead of an active week in the financial markets, Monday’s session is considered relatively calm from the perspective of economic data. Nevertheless, a pair of US data releases will make headlines at the start of North American trading.
Following a mostly quiet European session, the Federal Reserve Bank of Chicago will release the June National Activity Index at 12:30 GMT. The monthly report is designed to track overall economic activity in the world’s largest economy. In May, the National Activity Index reached -0.15.
North of the border, the Canadian government will report on wholesale sales at 12:30 GMT. The monthly gauge is projected to show 0.6% growth for May following a 0.1% uptick the month before.
At 14:00 GMT, the National Association of Realtors (NAR) will report on US existing home sales for the month of June. The latest reading is projected to show growth of 1.5% to a seasonally adjusted 5.47-million units. In May, existing home sales dipped slightly to 5.43 million.
The European Commission’s statistical agency will release the preliminary consumer confidence index for July at 14:00 GMT. The monthly print is expected to come in at -0.75 compared with 0.50 the month before. Measures of consumer confidence are used to gauge trends in consumer spending, which is a key driver of economic output for most advanced industrialized economies.
USD/CAD
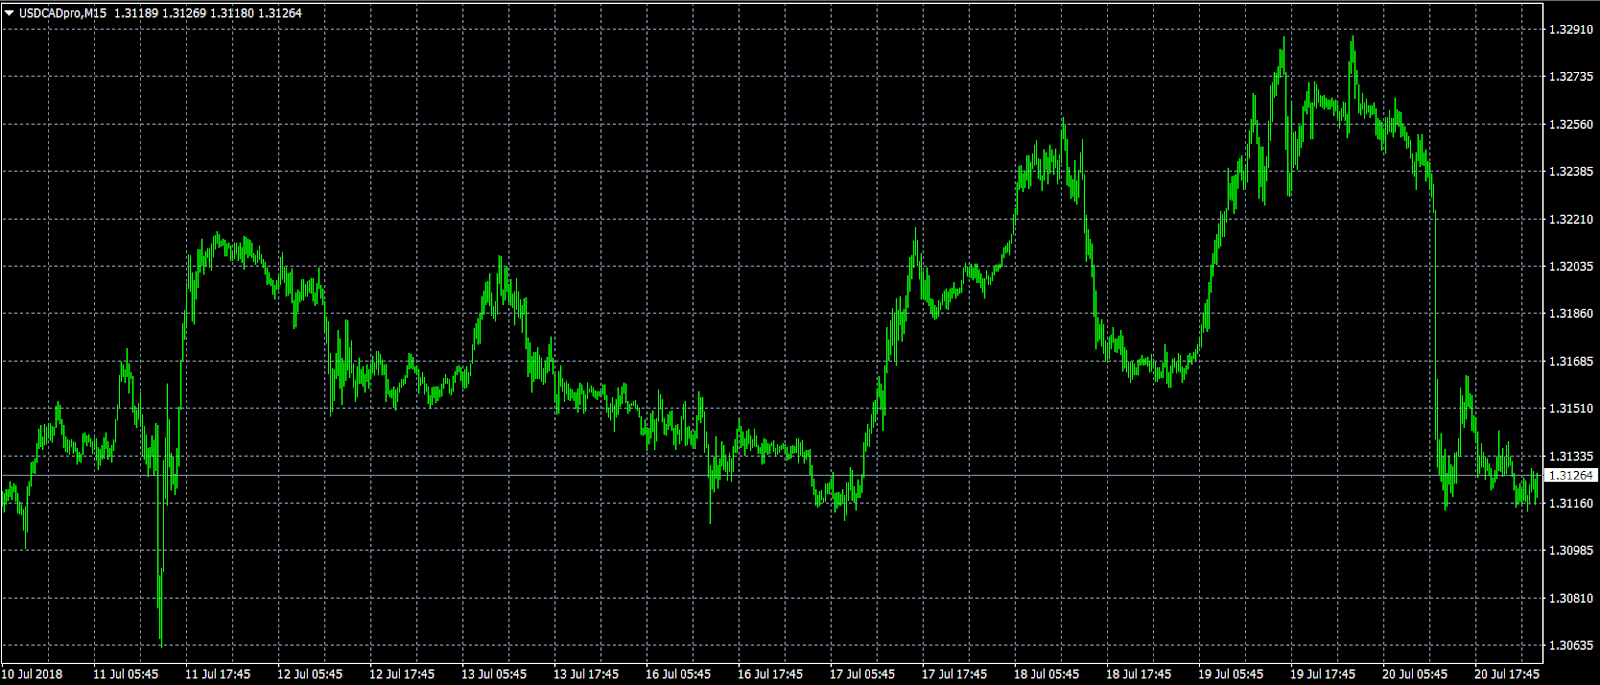
The Canadian dollar is coming off a productive Friday session following the release of solid retail sales figures. As a result, USD/CAD plunged to 1.3145 from a high of around 1.3300 earlier in the week. The pair has declined another 0.1% on Monday to trade at 1.3127. Investors can expect greater volatility for this pair amid NAFTA negotiations, central bank policy, and fluctuating oil prices.
EUR/USD
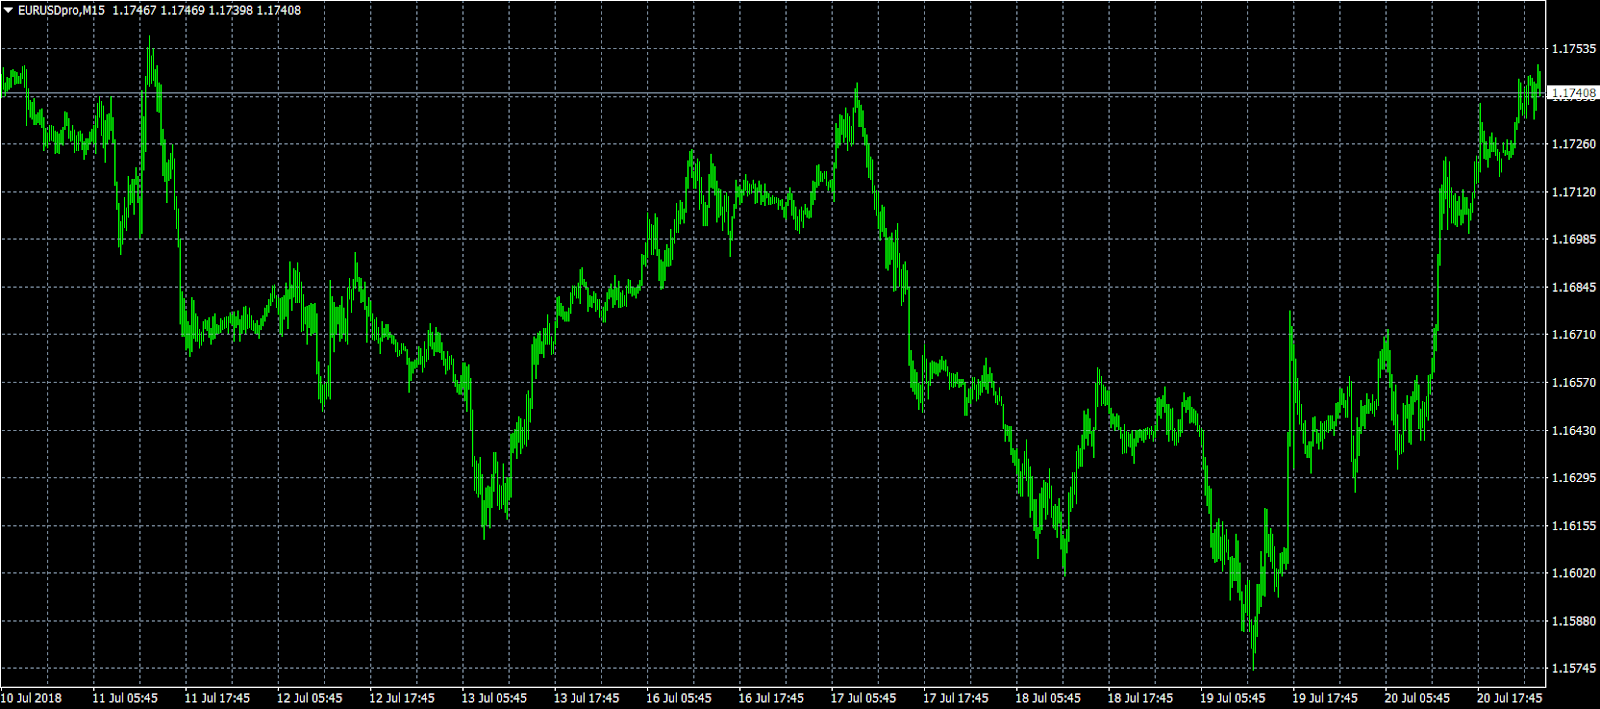
Europe’s common currency extended its rally against a slumping dollar on Monday, with prices climbing 0.2% to 1.1743. The EUR/USD exchange rate jumped 73 pips, or 0.6%, to 1.1718 on Friday as the dollar fell against a basket of currencies. The currency pair faces immediate support at 1.1695, followed by 1.1650. On the opposite side of the ledger, EUR/USD is eyeing resistance at 1.1750, followed by 1.1790.
USD/JPY
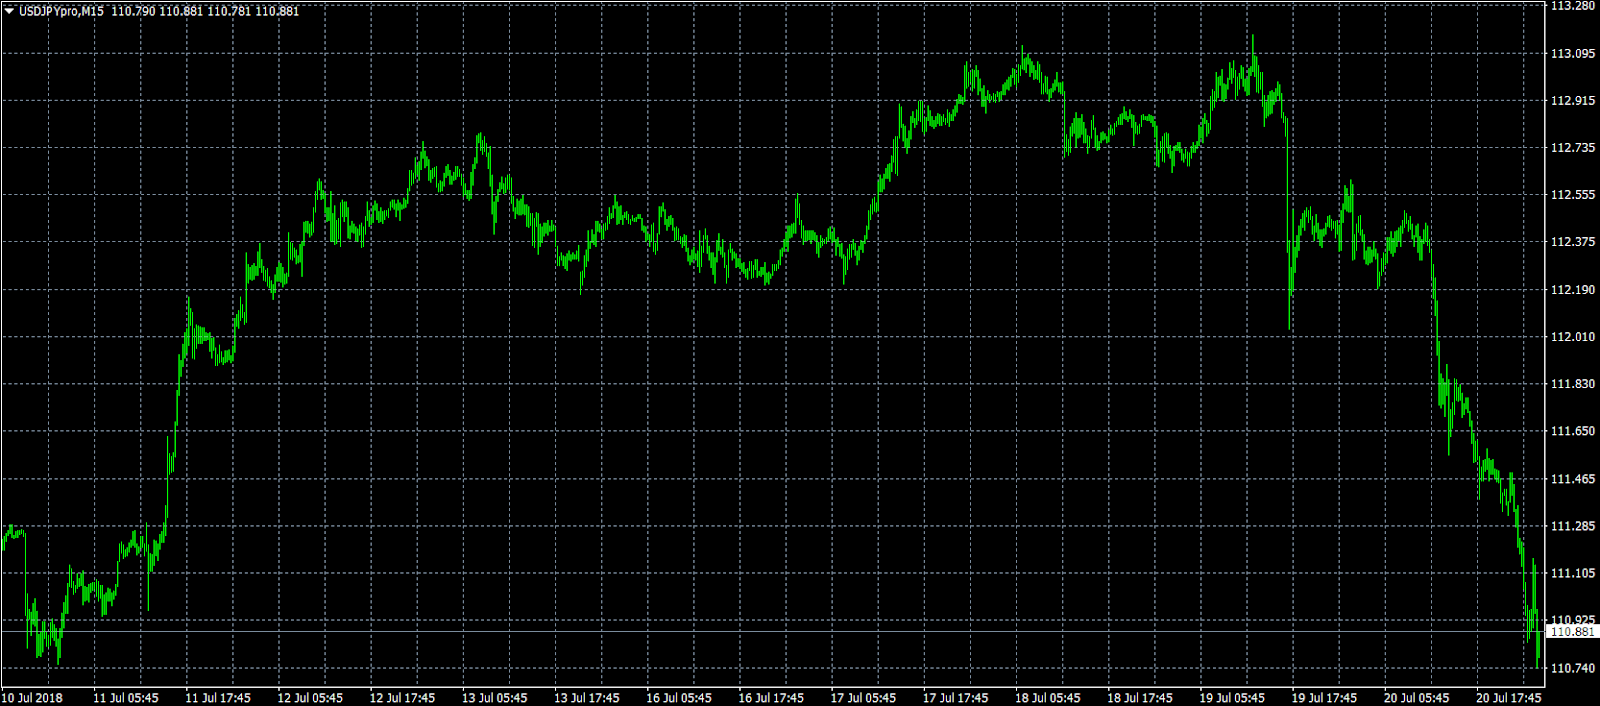
The Japanese yen opened the week in positive territory amid speculation that the Bank of Japan (BOJ) is considering tweaking its bond-buying program next week. USD/JPY is down 0.5% on Monday, extending its two-day slide to roughly 1%. The pair now sits at 110.84. Last week, USD/JPY surged to its highest level in six months. Short-sellers are being told to target USD/JPY at 108.10, with a stop limit at 113.40, according to Barclays. This suggests that analysts are pricing a bigger decline for the pair amid heightened trade tensions involving the US.


