Get 40% Off
⚠ Earnings Alert! Which stocks are poised to surge?
See the stocks on our ProPicks radar. These strategies gained 19.7% year-to-date.
Unlock full list

U.S Crude Oil At 3 Year Highs

Published 01/10/2018, 06:53 AM
Updated 03/21/2024, 07:45 AM

U.S. Crude Oil (WTI) traded above the $63 handle on Tuesday, as the American Petroleum Institute (API) reported an exceptionally large draw of 11.19 million barrels of U.S. crude oil inventories for the week ending 5th January, against an expectation of 3.89 million barrels. This is the sixth week in a row that API has reported large draws. Oil prices have also been supported by a year of production cuts led by the Organization of the Petroleum Exporting Countries (OPEC) and Russia. The cuts, which started in January 2017, are scheduled to continue through 2018.


Attention will now turn to the Energy Information Administration (EIA) inventory data due on Wednesday. If the large draw is replicated, it would be the biggest decline in inventories for this time of the year since 1999.

WTI Weekly

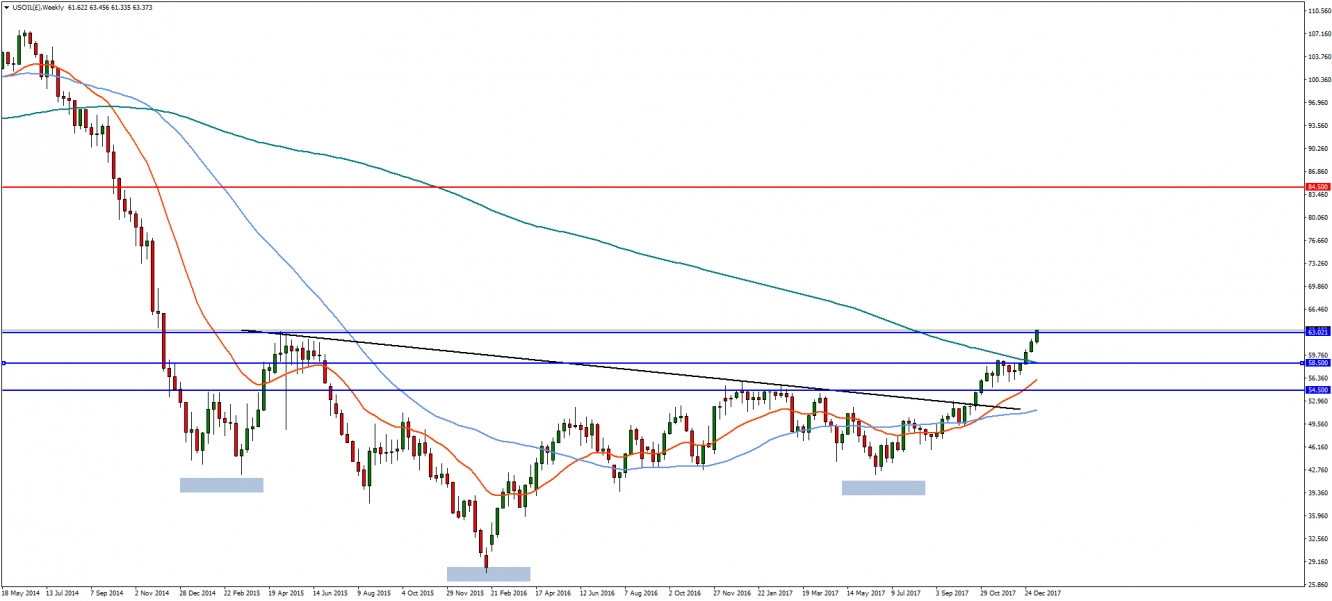
Taking a longer-term view using the weekly chart, WTI price action is comfortably above the 200 week moving average. An inverted H&S pattern indicates a potential long-term target of 84.50. A drop back below the 200MA at 58.50 would be the first signs of a major reversal. A break below support at 54.50 would negate the bullish pattern.

WTI Weekly Chart

WTI Daily

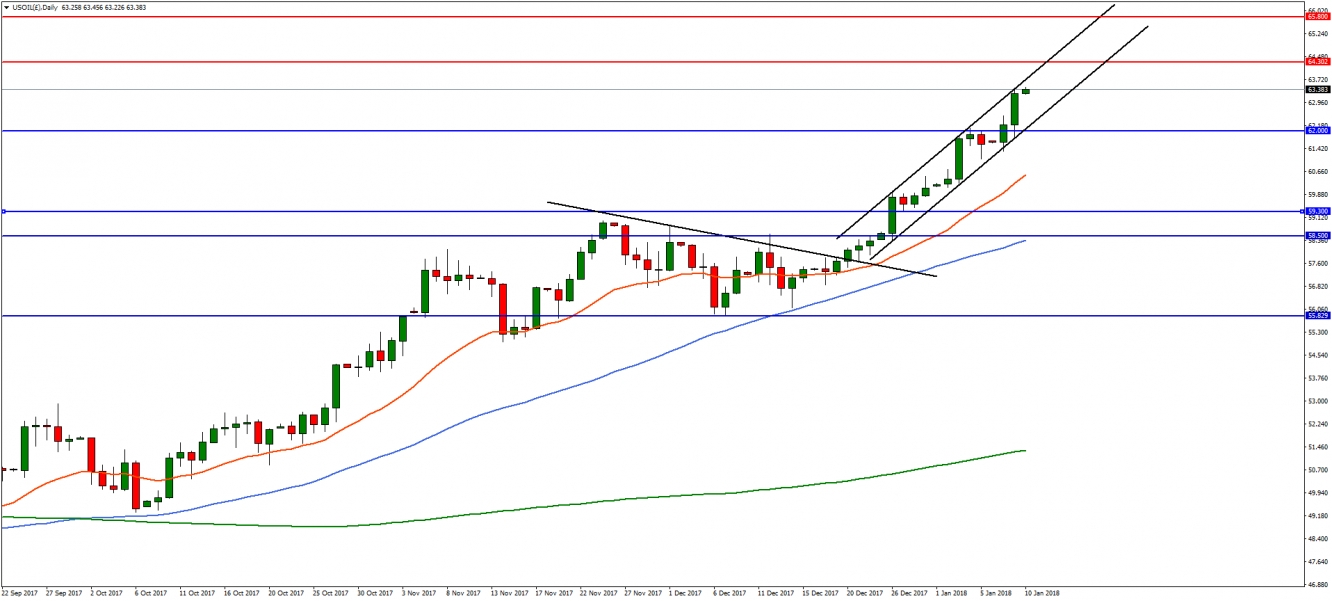
U.S. Crude is seen to be trading in a rising channel and, provided support at 62.0 is held, continued bullish sentiment would target 64.30 followed by 65.80. However, a reversal could stall at Fibonacci retracement and horizontal support at 59.30. A breakthrough here would lead to a test of the 200 Week MA at 58.50.

WTI Daily Chart

Latest comments

Risk Disclosure: Trading in financial instruments and/or cryptocurrencies involves high risks including the risk of losing some, or all, of your investment amount, and may not be suitable for all investors. Prices of cryptocurrencies are extremely volatile and may be affected by external factors such as financial, regulatory or political events. Trading on margin increases the financial risks.
Before deciding to trade in financial instrument or cryptocurrencies you should be fully informed of the risks and costs associated with trading the financial markets, carefully consider your investment objectives, level of experience, and risk appetite, and seek professional advice where needed.
Fusion Media would like to remind you that the data contained in this website is not necessarily real-time nor accurate. The data and prices on the website are not necessarily provided by any market or exchange, but may be provided by market makers, and so prices may not be accurate and may differ from the actual price at any given market, meaning prices are indicative and not appropriate for trading purposes. Fusion Media and any provider of the data contained in this website will not accept liability for any loss or damage as a result of your trading, or your reliance on the information contained within this website.
It is prohibited to use, store, reproduce, display, modify, transmit or distribute the data contained in this website without the explicit prior written permission of Fusion Media and/or the data provider. All intellectual property rights are reserved by the providers and/or the exchange providing the data contained in this website.
Fusion Media may be compensated by the advertisers that appear on the website, based on your interaction with the advertisements or advertisers.
© 2007-2024 - Fusion Media Limited. All Rights Reserved.