As Hurricane Irma churns through the Caribbean, the Unites States is faced with something that it has not experienced before: two hurricanes of category 4 or higher hitting the country in the same year. As we write, Irma’s path is still in doubt, with possibilities ranging from the east coast of Florida and the Miami area to the west coast of Florida, possibly impacting our firm’s home city of Sarasota. All of this happening as the citizens of Southeast Texas are recovering from the devastating effects of Hurricane Harvey.
There has been much written over the years about the effects of hurricanes on equity markets. Clearly, such calamities have caused drop-offs in economic activity, followed by upticks in spending and consumption as affected areas rebuild. There is also considerable literature on the effects of large storms on property and casualty (P&C) companies. Generally speaking, these companies pay out substantial claims after the storms but usually benefit down the road as they obtain pricing power for future insurance premiums.
We wanted to look at some of the major storms in the United States to see if we could discern any trends or effects from these meteorological events on the bond markets – both the Treasury market and the tax-exempt municipal bond market. My colleague Gabriel Hament and I looked at the most damaging storms of the past thirty years, taking us from Hurricane Hugo, which ravaged South Carolina and Charleston in particular in 1989, to Hurricane Ike, which hit Galveston, Texas in 2008. The haymaker of all hurricanes, of course, was Katrina in 2005, which devastated New Orleans and Louisiana. The relatively docile period of the past nine years has now come to a vicious close with the twin punches of Harvey and Irma. And though figures are not in yet, it is likely that the cost of Harvey will be even greater than that of Katrina.
The Charts Below
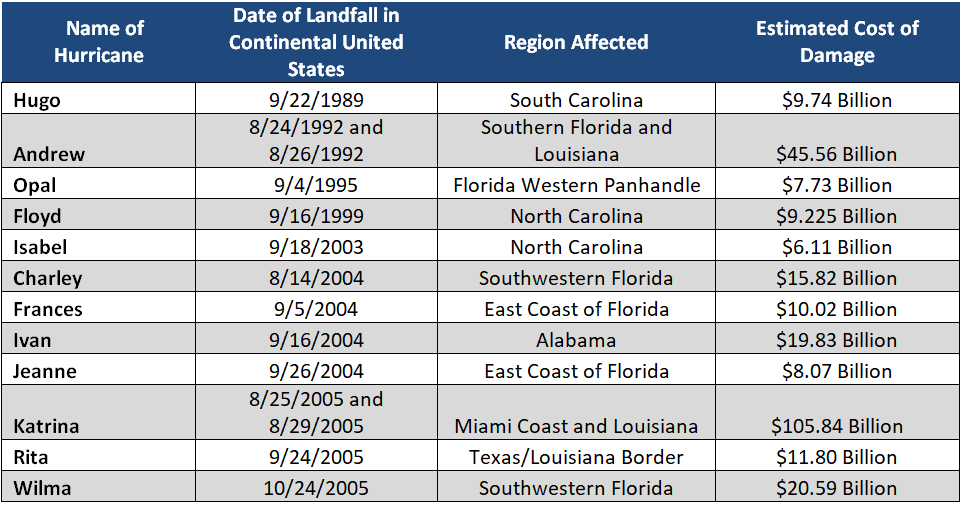
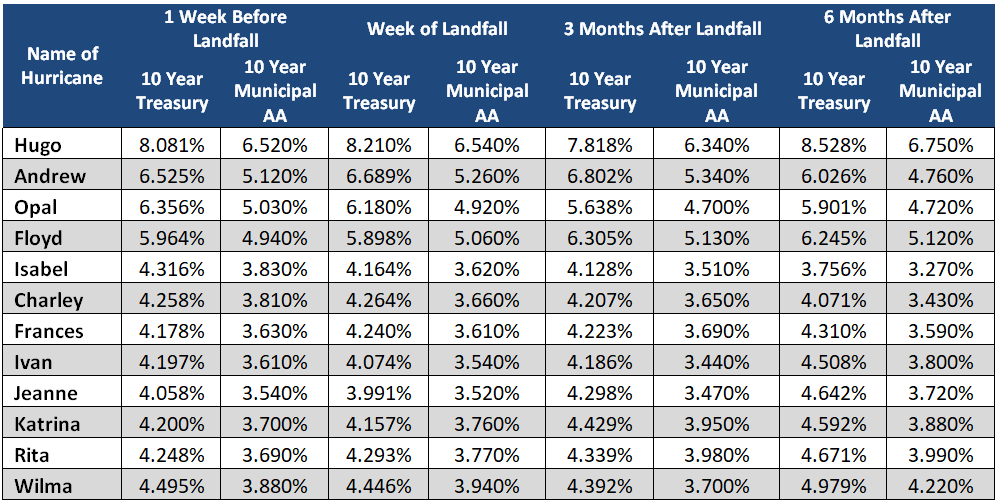
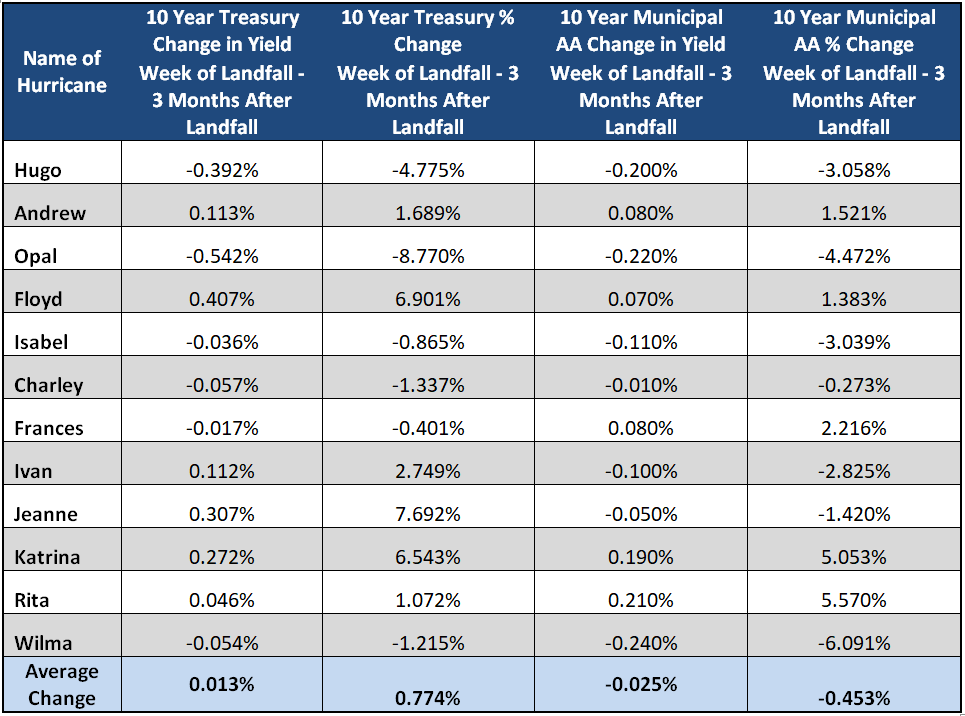
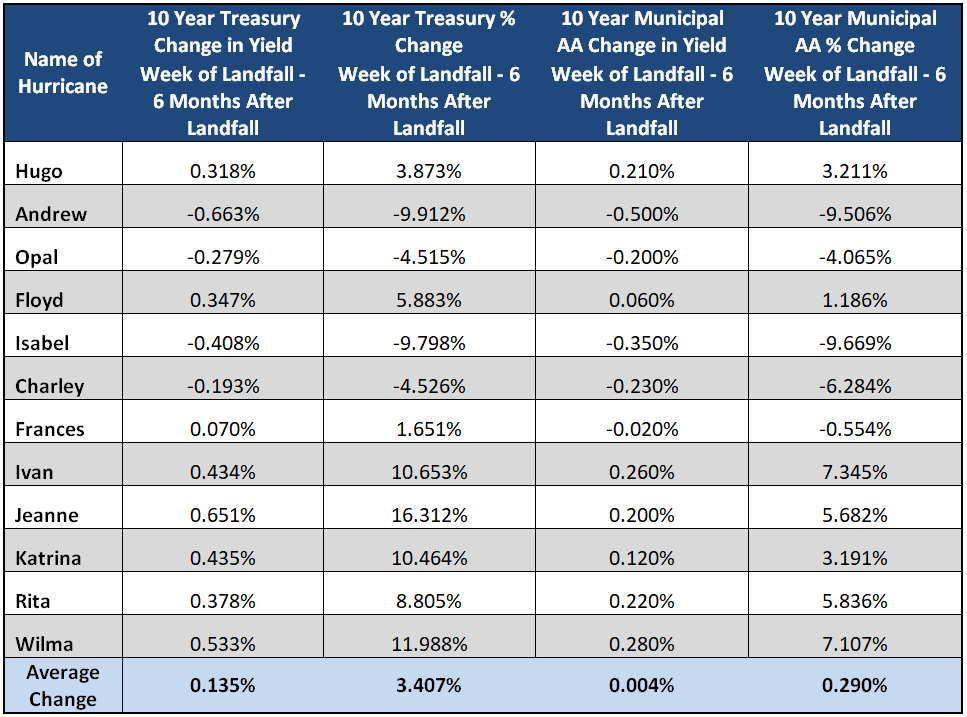
In the charts at the end of the piece you’ll see that we list twelve of the most destructive hurricanes of the past thirty years, including the date of landfall, the regions affected and the estimated cost of damage, which is adjusted to 2010 dollars. We then cite the ten-year US Treasury yield as well as the ten-year Moody’s municipal bond yield the week before the storms, the week of landfall, three months after landfall and six months after landfall. We also look at changes in the Treasury and muni 10-year yields from the week of landfall to three months after landfall, as well as changes from the week of landfall to six months after landfall. For comparison purposes, we look at the PERCENTAGE of yield changes, so that periods with different interest-rate levels can be compared.
Note that we didn’t include Hurricane Ike in our review of interest-rate changes when the economy was in free fall in September 2008 as Ike made landfall the day after Lehman Brothers declared bankruptcy.
What We Found
The story is somewhat mixed. On the 10-year Treasury side, in six out of twelve storms, the result was higher 10-year bond yields three months after landfall. In the six storms with lower yields, the average drop was 18 basis points or an average drop of 2.9% of total yield (since we are comparing yield drops in different interest-rate environments). For the six periods where there was a rise in rates three months later, there was an average rate rise of 20 basis points, or an average rise in overall total yield of 4.45%. This higher percentage is due to the fact that four out of the last five storms we examined occurred in 2004 or later, when we were in a lower interest-rate environment than in the ’90s or early ’80s.
Six months after landfall, there is a bias toward higher Treasury yields. Of the twelve storms, four saw lower 10-year Treasury yields six months after landfall and eight witnessed higher ones. Of the four storms with lower yields, the average yield drop was 38 basis points, for an average percentage of total yield drop of 7.18%. Of the eight storms that saw higher yields six months later, the average rise was 40 basis points, an average total percentage yield rise of 8.7%. The last six storms chronologically saw higher yields six months later.
On the muni side, for the three-month period after landfall, seven out of twelve storms saw lower yields, with the average drop being 13 basis points in the Moody’s 10-year AA scale and an average of 3.02% drop in total yield. On a six-month basis, five storms saw a drop in 10-year muni yields, with the average drop being 26 basis points or an average percentage drop of 6.01% of total yield. Seven storms saw a rise in yields six months later, with an average rate rise of 19 basis points or 4.8% of total yield. The last six storms all saw a 3-month rise in muni yields (albeit some of them small), and the last five all saw rises on a 6-month basis.
What's The Data Say?
Without being overly scientific, it is clear that in more recent times, we have experienced a yield rise more often than not as we moved six months out past a serious hurricane. The fact that this happened during periods of generally declining interest rates is also important. The muni yield drop or rise is more muted than that of Treasuries, which is explained by the fact that because of the tax exemption, you need less of a change in munis to match Treasuries on a taxable equivalent basis. We think it also points to the overall quality of municipal debt and the fact that areas tend to rebuild (particularly more recently), although that can take months or years in severely damaged areas. We observe RISING yields, particularly in the Treasury area, after eight out of twelve storms and the last six storms in a row. We think that points to overall better insurance coverage as well as quicker response by Federal agencies with relief dollars. This response translates, of course, into a higher level of economic activity in the years after a storm as bond markets perceive a potentially higher level of inflation.
With Hurricane Harvey hitting Texas and Irma now bearing down on Florida, we think there could be a sizable amount of insurance money and federal dollars at work in rebuilding the affected areas. From a portfolio management standpoint, we have sold some selective credits ahead of Irma, the idea being that the lower-rated, uninsured bonds of smaller coastal areas are more vulnerable to headline risk than other credits that are larger or higher rated. We have practiced this approach for years.
As for the future path of interest rates, we look to the more recent history of bond yields after storms, combined with the fact that we are in a period when the Federal Reserve is slowly pushing up short-term rates as it prepares to gradually reduce its balance sheet. Factor in the impact of rebuilding after two massive hurricanes plus insurance proceeds and federal dollars – particularly as it has been some time since the last category 4/5 hurricanes – and common sense leads us to believe that higher rates lie ahead of us in 2018.
We pray for the safety of all the folks in the affected areas and we’ll be back to inform readers on Irma's impact.

Sources: Weather Underground, National Hurricane Center
Source: Bloomberg
Source: Bloomberg

Source: Bloomberg
