The latest Fed Minutes noted the US is still in fairly good shape. The US consumer continues spending, unemployment is low, retail sales are expanding moderately, and purchases of durable goods (vehicles and houses) are positive. The primary negative is weak wage growth. But the strong dollar, weak overseas economies and slowdown in the oil patch is hurting the manufacturing sector:
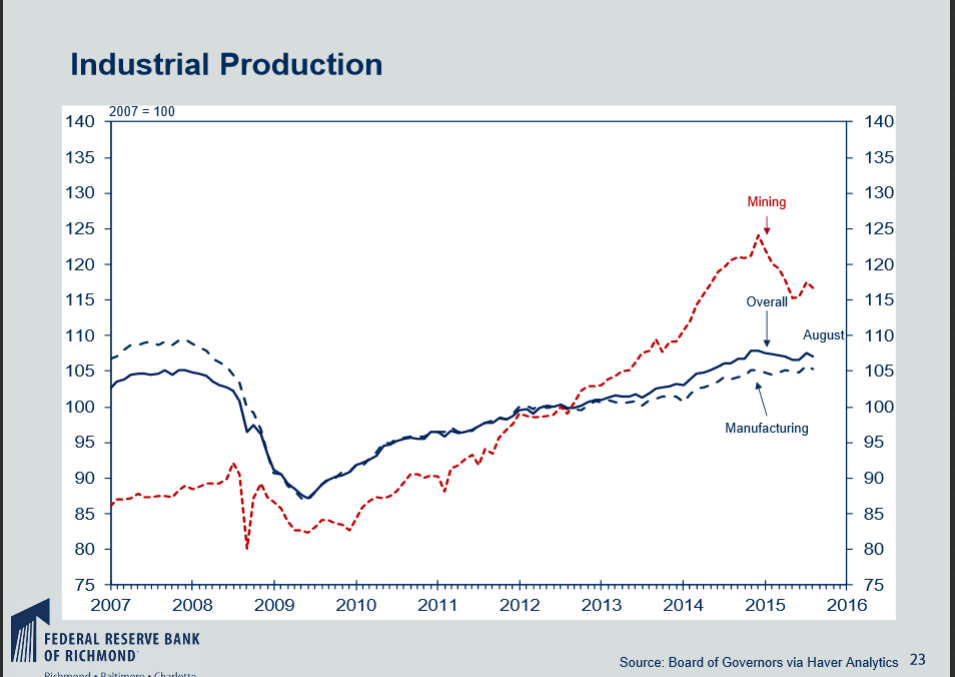
Mining production dropped sharply at the beginning of the year, which explains most of the decline in industrial production. But also consider the decline in two sub-indexes of the ISM report: new orders (blue) and new export orders (red):
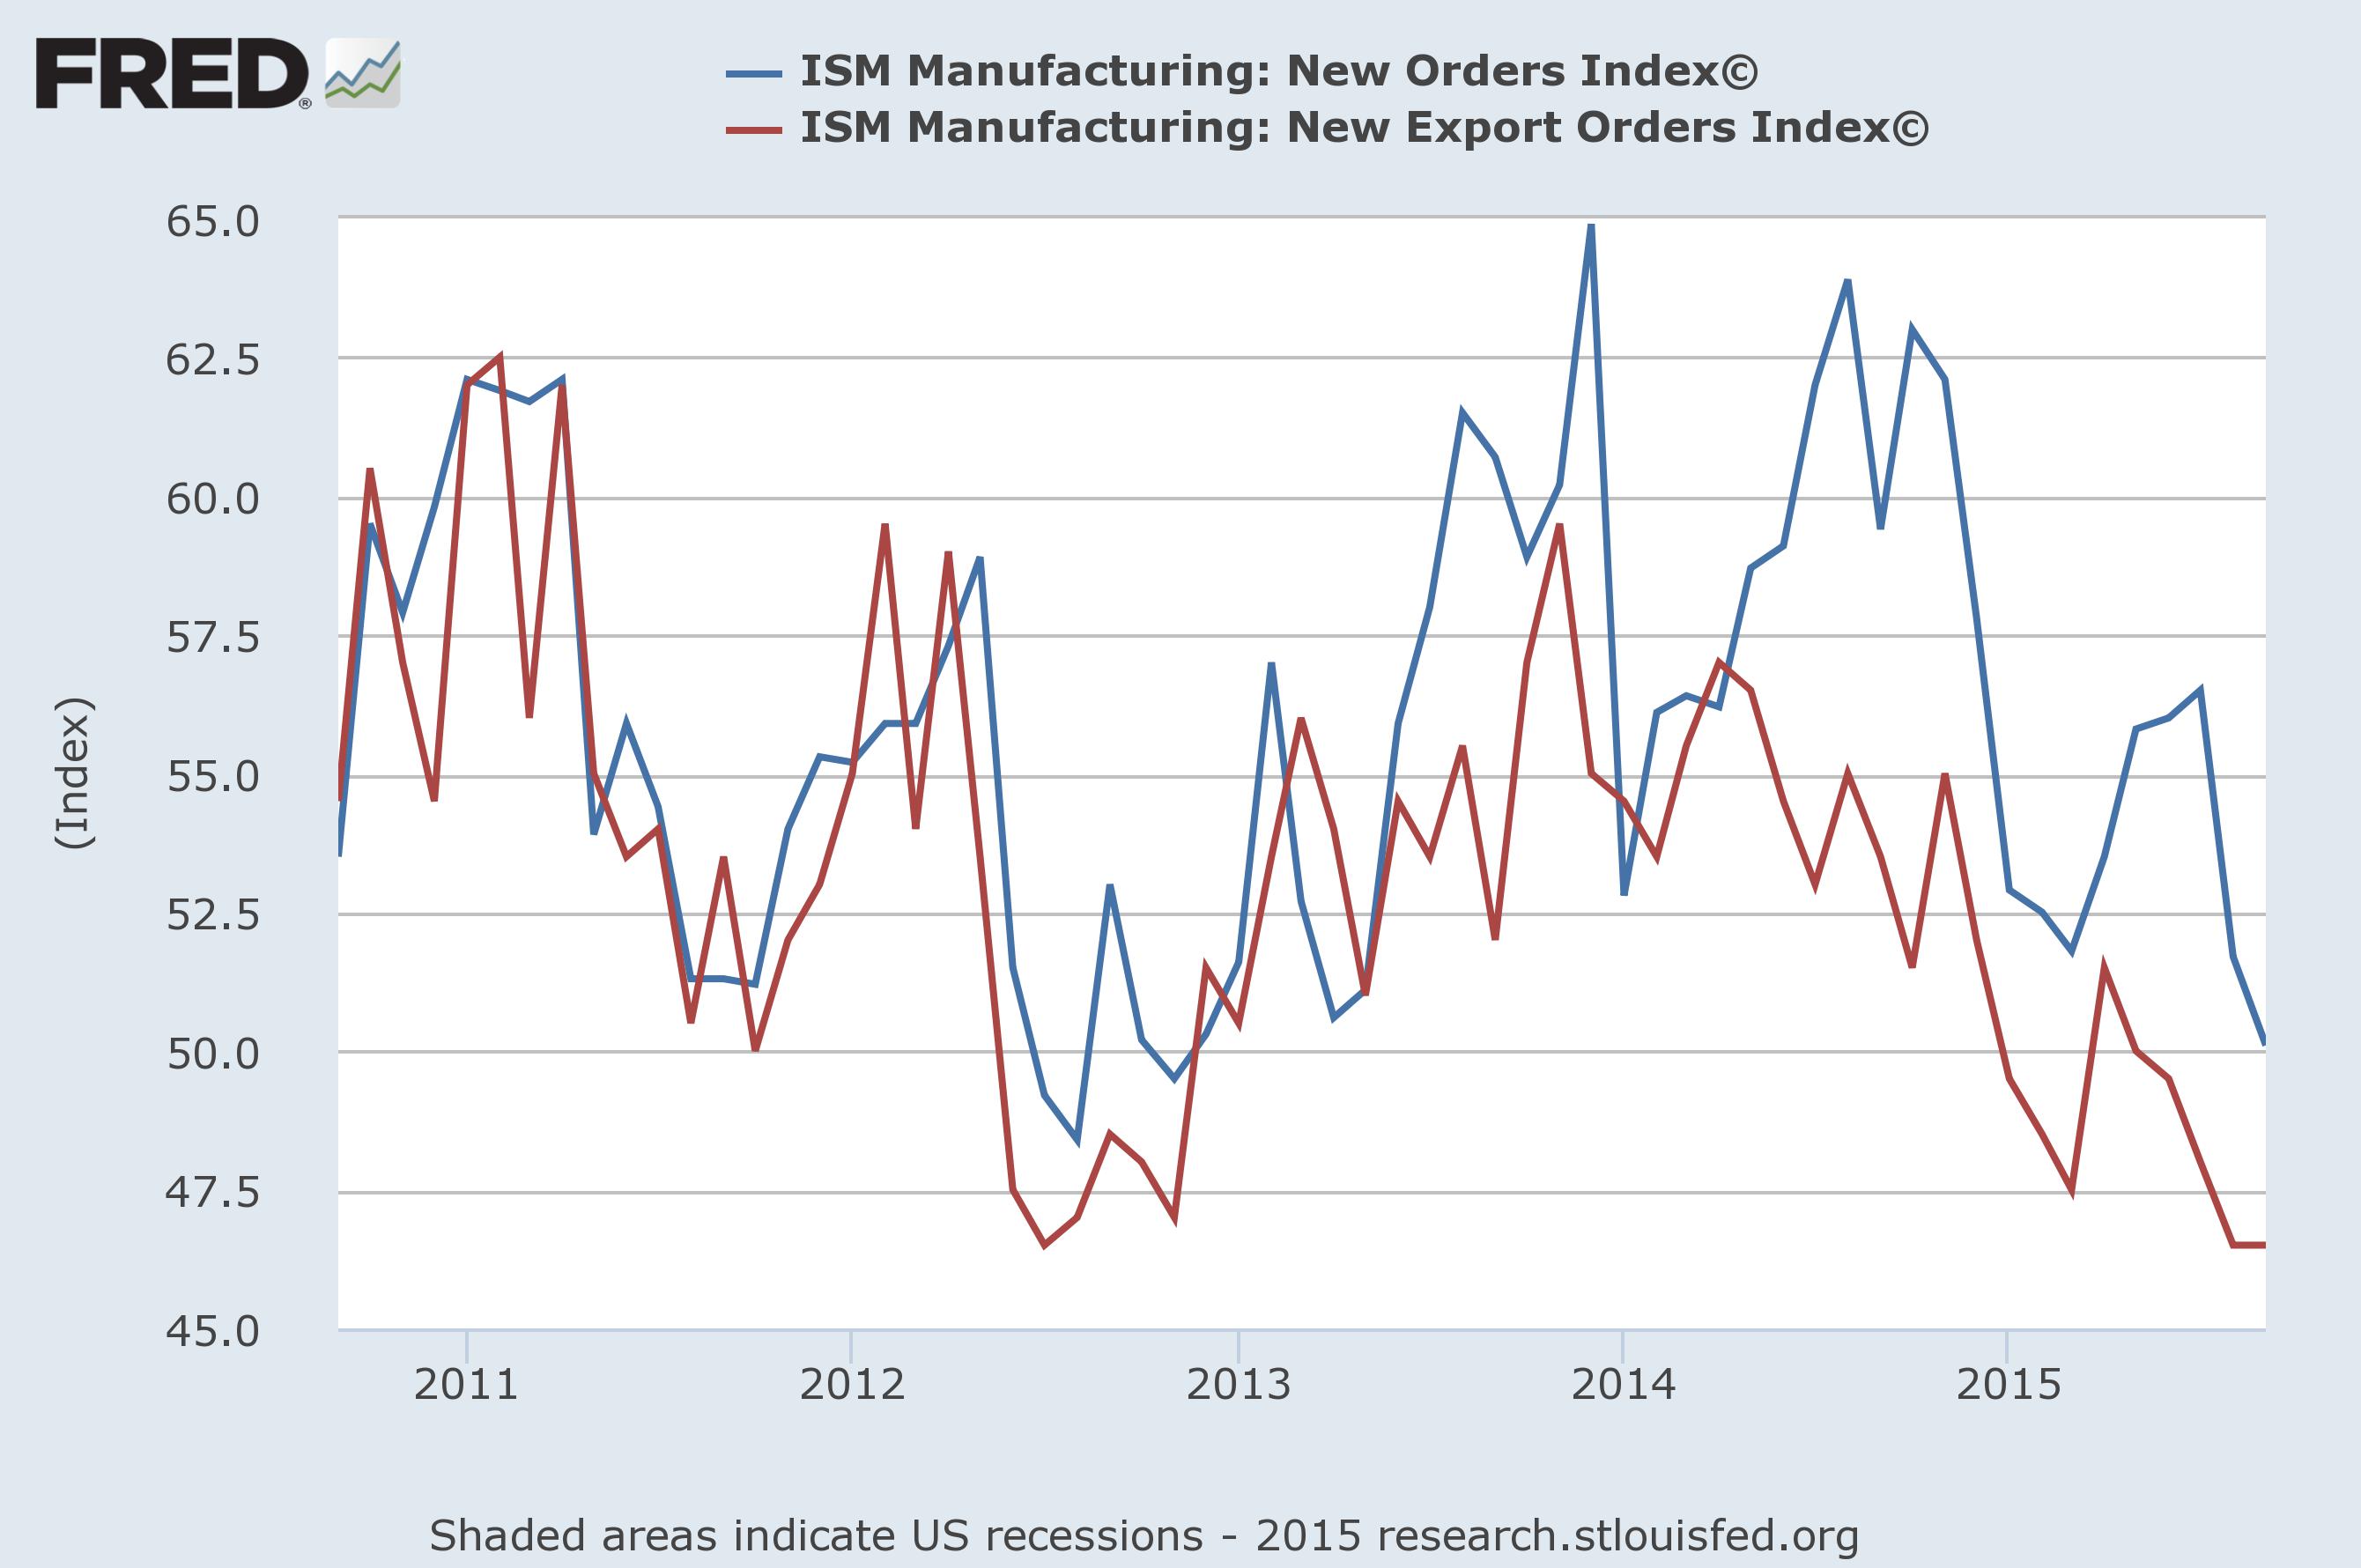
New export orders are contracting and total manufacturing orders are close to the 50 level (the line that separates expansion from contraction). This is consistent with the drop in manufacturer’s new orders and core capital goods:
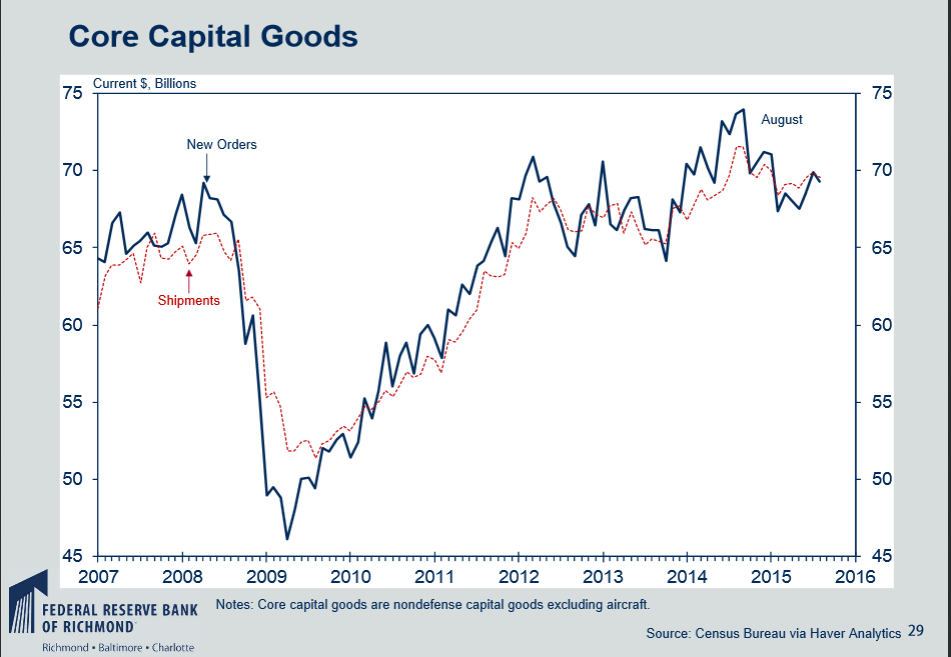
While the US industrial base is not in a full-blown recession, it has obviously taken a hit.
The latest minutes were dovish — not due to the shallow industrial recession, but instead because of international developments. Consider the following from the latest Fed Minutes:
In assessing whether economic conditions had improved sufficiently to initiate a firming in the stance of policy, many members said that the improvement in labor market conditions met or would soon meet one of the Committee's criteria for beginning policy normalization. But some indicated that their confidence that inflation would gradually return to the Committee's 2 percent objective over the medium term had not increased, in large part because recent global economic and financial developments had imparted some restraint to the economic outlook and placed further downward pressure on inflation in the near term. Most members agreed that their confidence that inflation would move to the Committee's inflation objective would increase if, as expected, economic activity continued to expand at a moderate rate and labor market conditions improved further. Many expected those conditions to be met later this year, although several members were concerned about downside risks to the outlook for real activity and inflation.
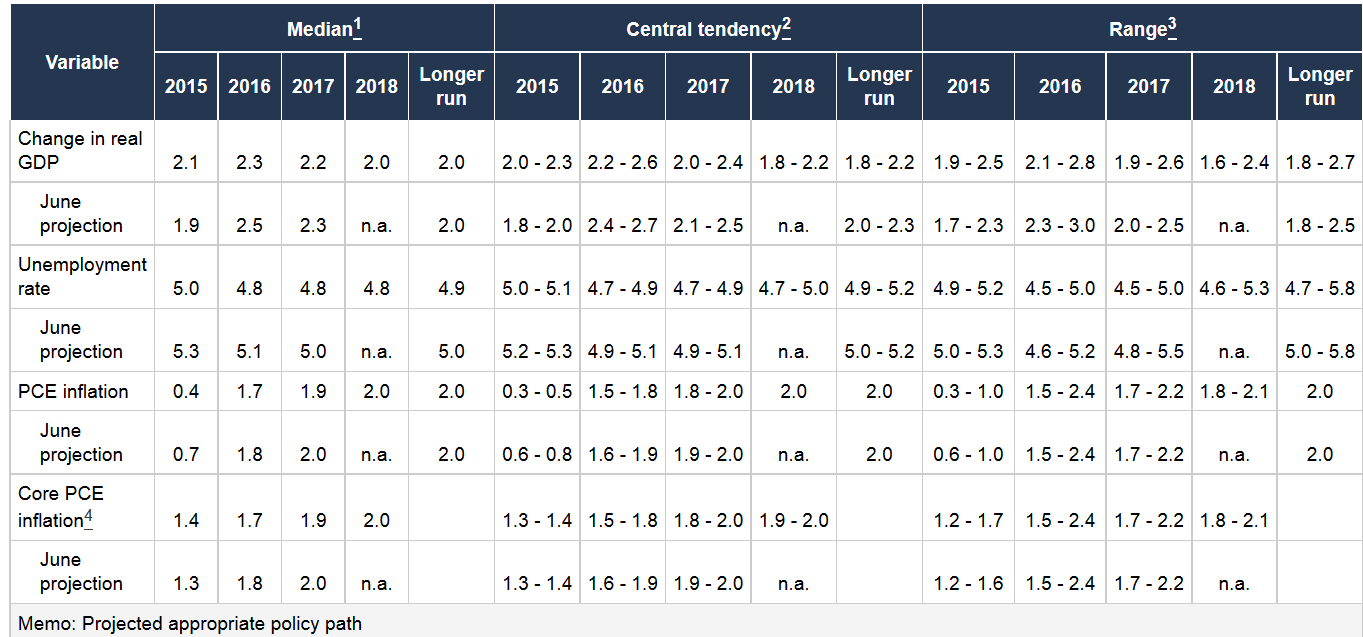
It’s all about prices and international developments. Previous minutes and Fed statements were confident that energy prices would eventually rise, pulling inflation higher. The Fed treated this relationship as sacrosanct. But the slowing global economy is dampening that expectation. The decline in China’s raw material appetite is lowering emerging market demand for goods and services from the developed markets. And the global slowdown is placing a bid under the dollar, lowering US imports costs. This means US CPI is dropping from two very strong global forces: weakening global demand and a stronger currency. These two factors will exist so long as Chinese growth is slowing. Interestingly enough, Fed GDP projections were revised slightly higher for 2015 but lower for 2016-2017. But they lowered their inflation expectations for the same years:
As for the treasury market, notice that on the weekly chart, the N:IEFs and N:TLTs are both near multi-year highs:
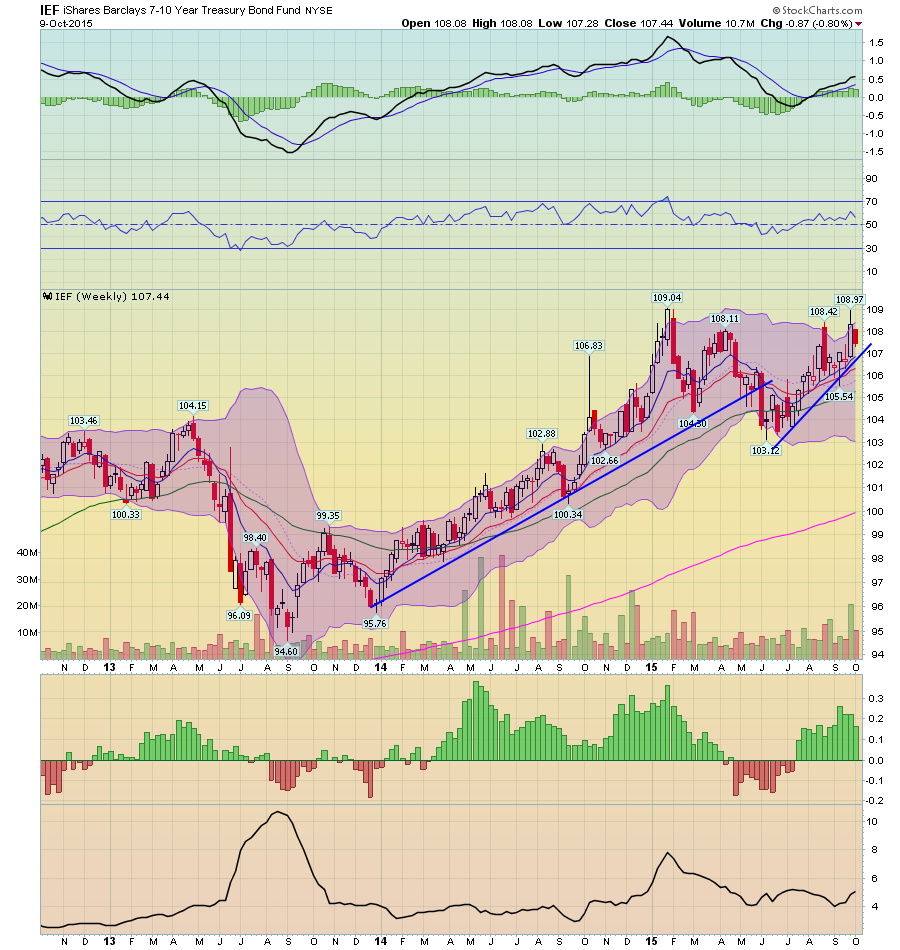
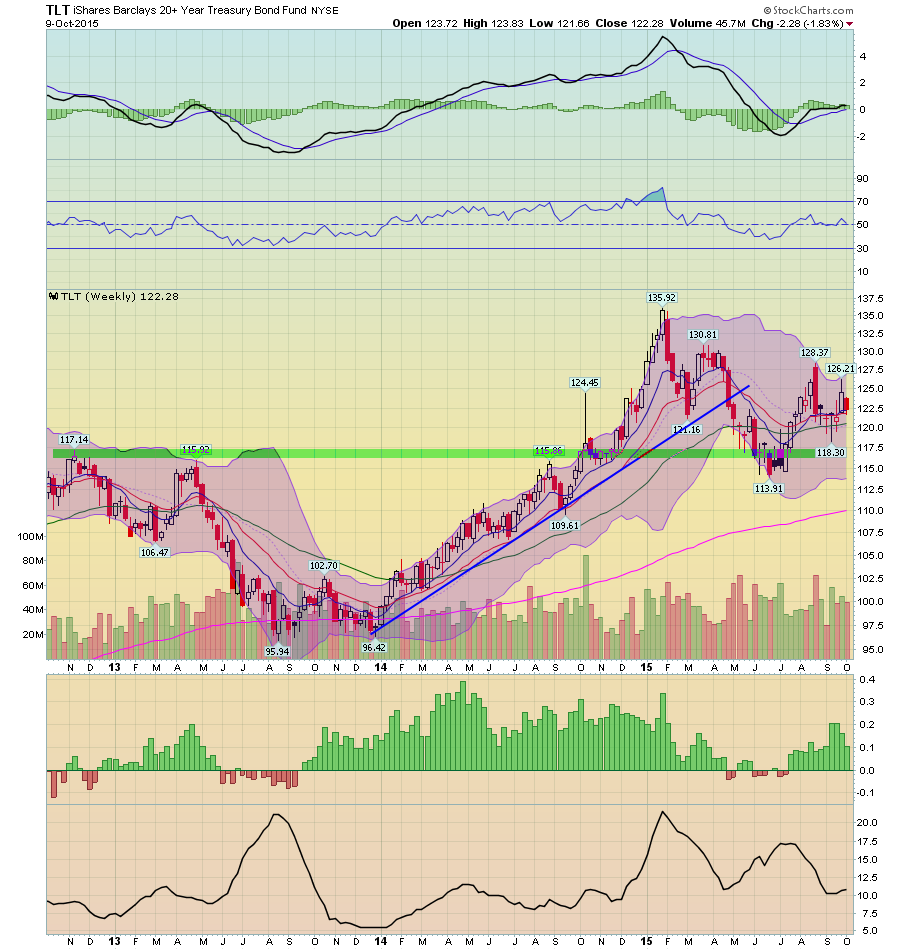
The IEFs (top chart) began moving higher in late 2013, rising from the 94.5 level to 109 in early 2015. They sold off to the 103 level in the spring, but have since rallied back to the 108 level. Momentum is positive and price strength is bullish. The TLTs (bottom chart) rose from ~95 to ~ 135 between late 2013 and early 2015. They too sold off last spring, but started to rally mid-summer in conjunction with increased Chinese volatility. Momentum is slightly less bullish than the IEFs, but still positive.
And finally, there’s the yield curve spread:
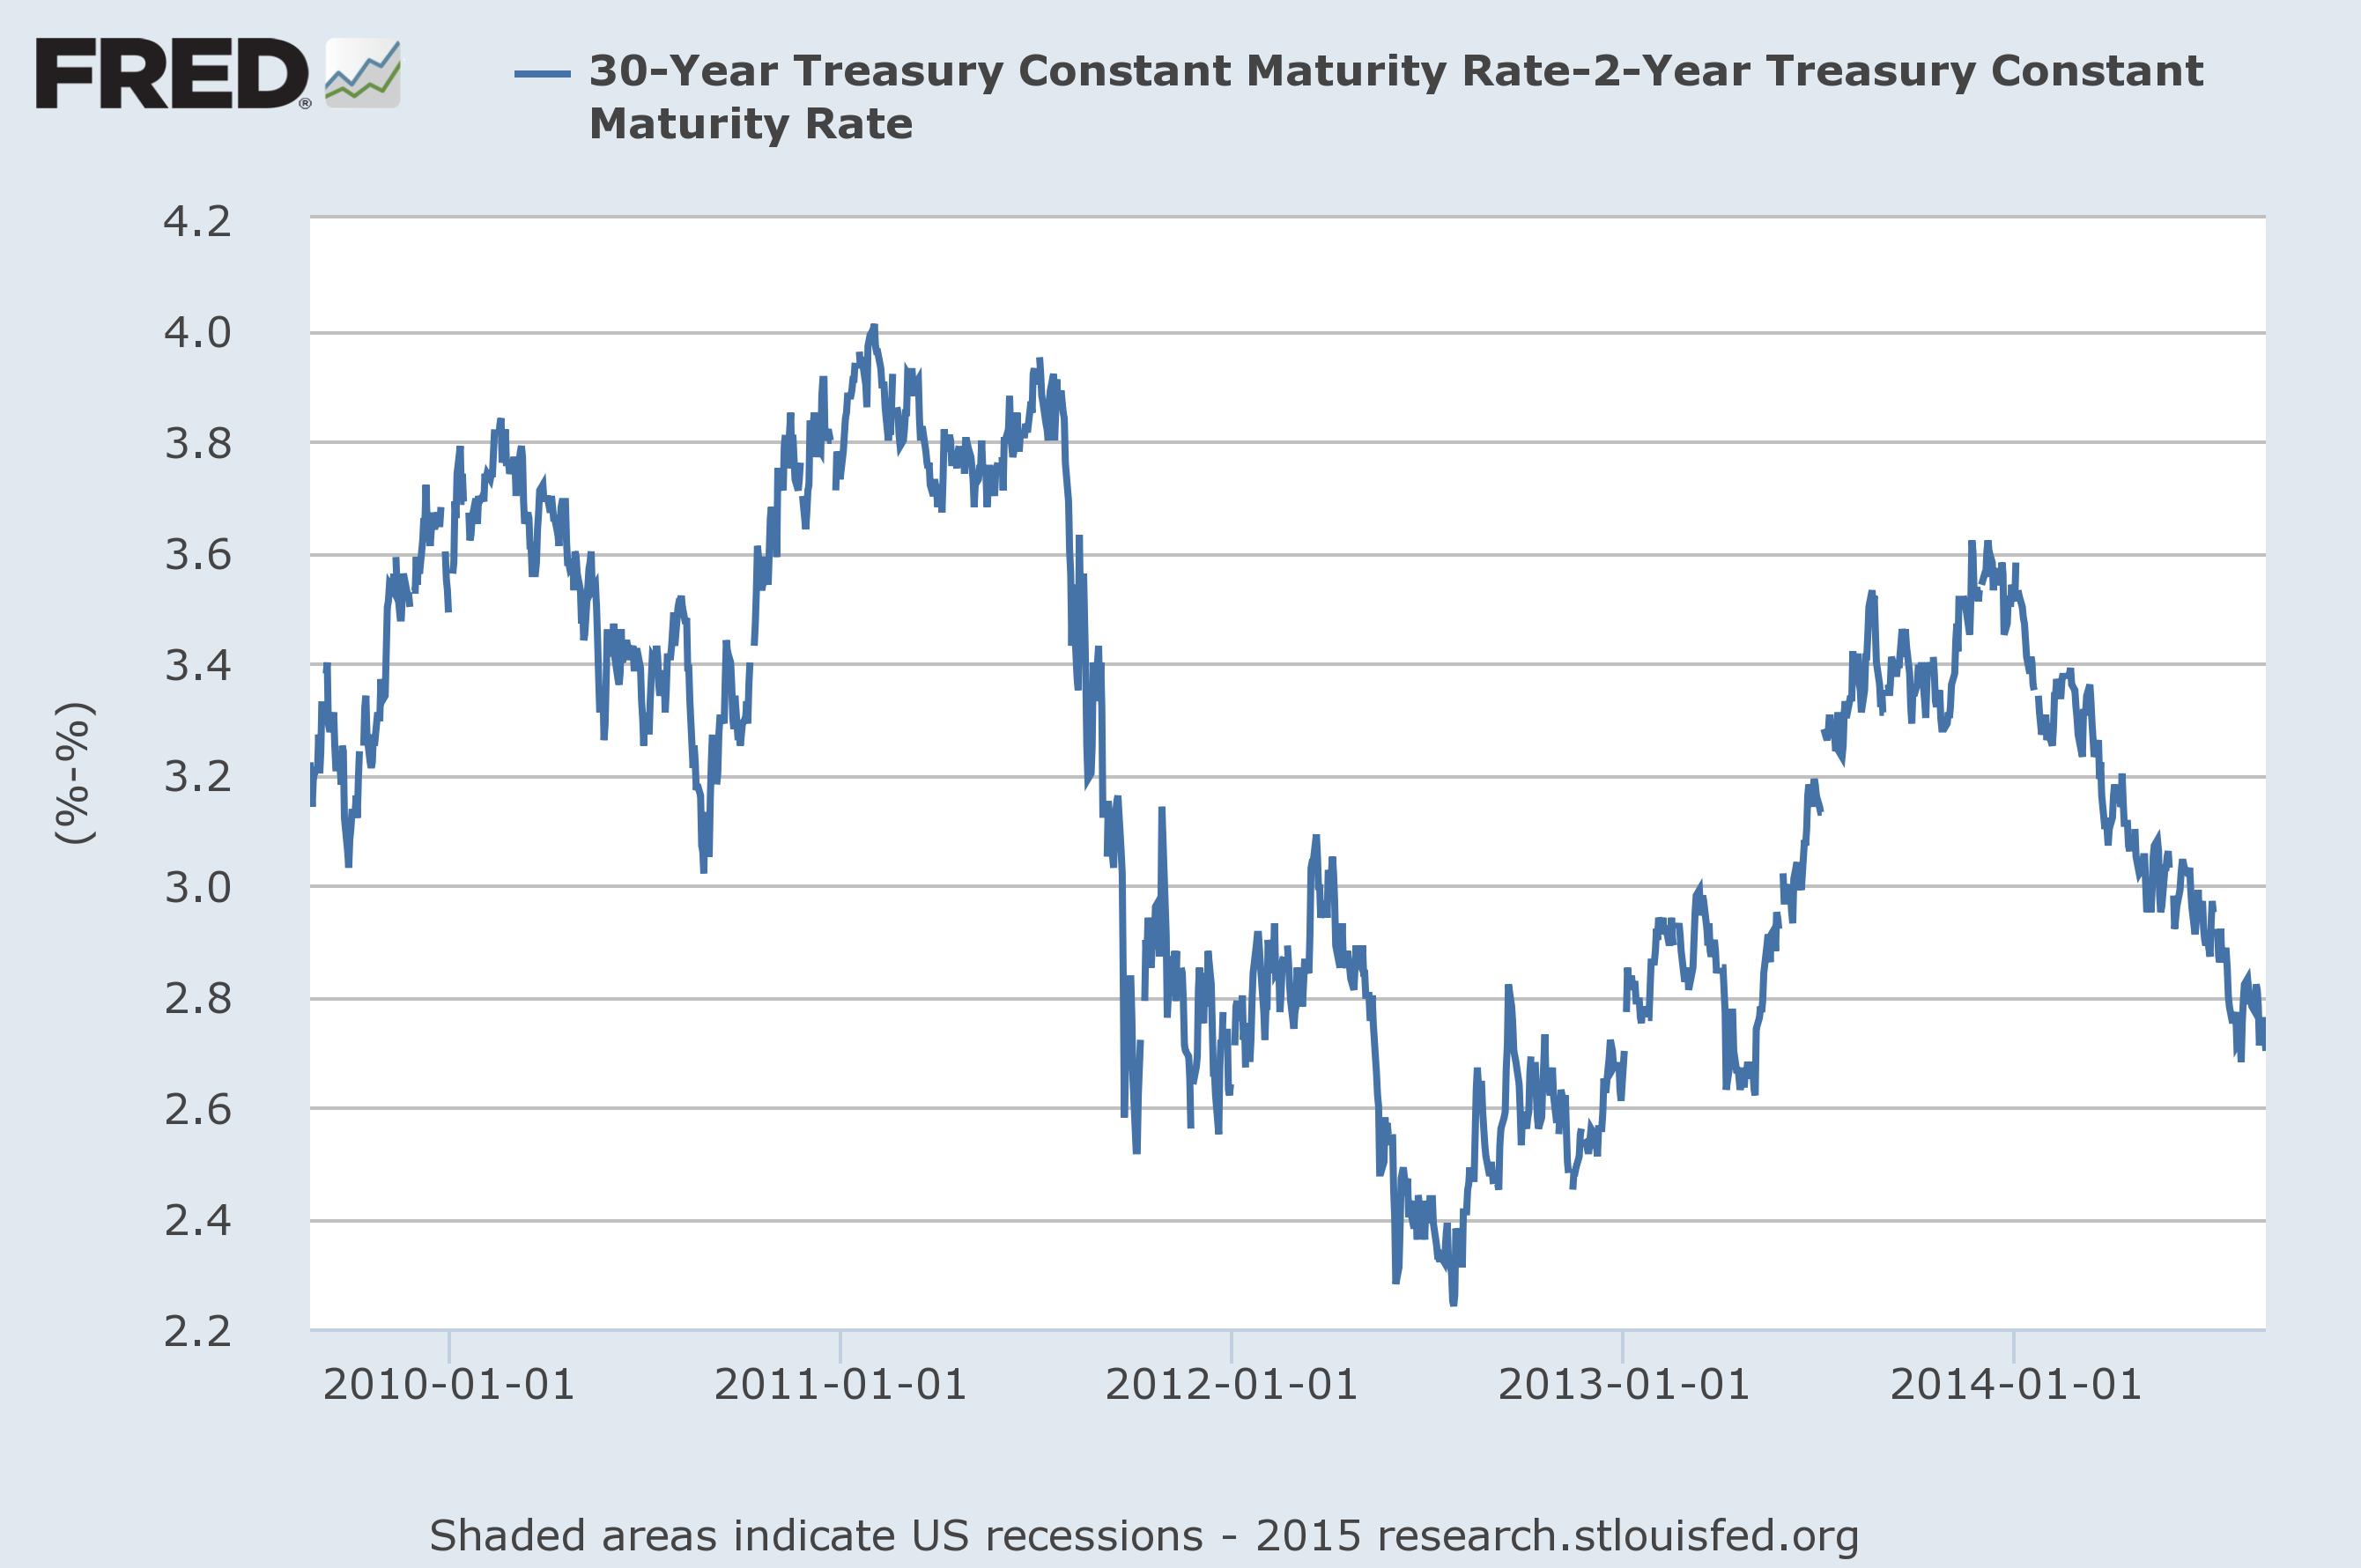
The 30-2 yield spread is 2.24%. In the current environment, this is not indicative of stronger growth, which is confirmed by the weak 3Q GDP projections.
A strong safety bid exists in the treasury market. Chinese and emerging market volatility are the primary cause. But US equity weakness, weak revenue growth, and low inflation are contributing. It's difficult to see the market selling off in the current environment.
