Get 40% Off
🚨 Volatile Markets? Find Hidden Gems for Serious OutperformanceFind Stocks Now

2-Year And 10-Year Yields And Their Potential Effect On U.S. Bank Stocks

Published 07/22/2018, 12:08 AM
Updated 07/09/2023, 06:31 AM

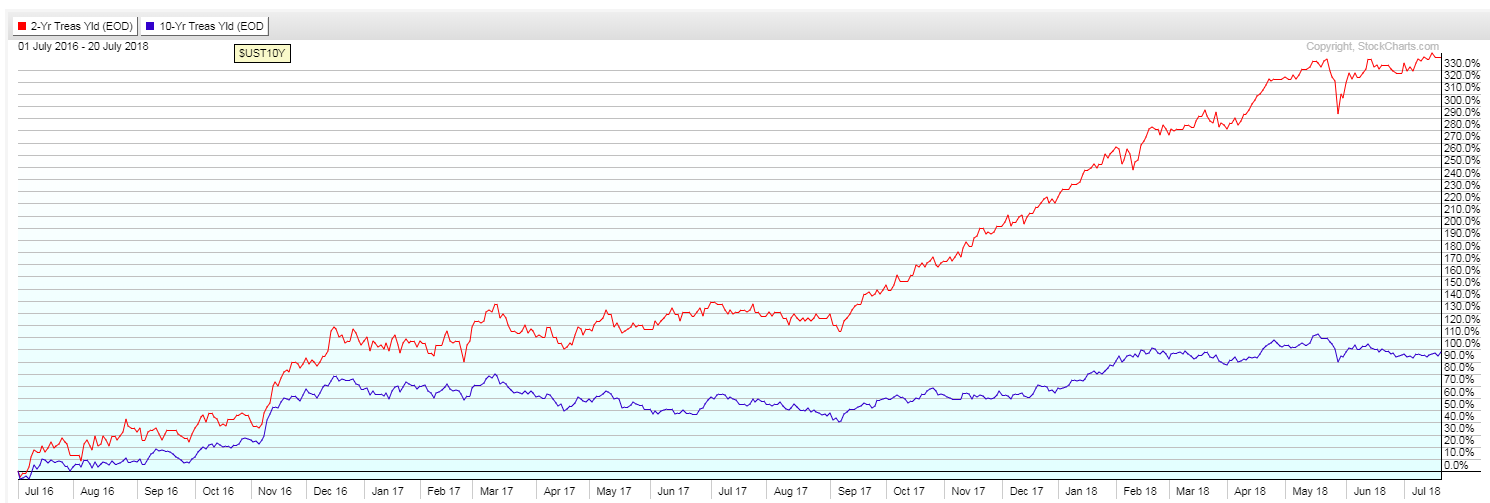
During the past year, or so, U.S. 2-Year Treasury Yields have shot up sharply, in comparison with 10-Year Yields, as shown on the following weekly price comparison chart and percentage comparison chart.
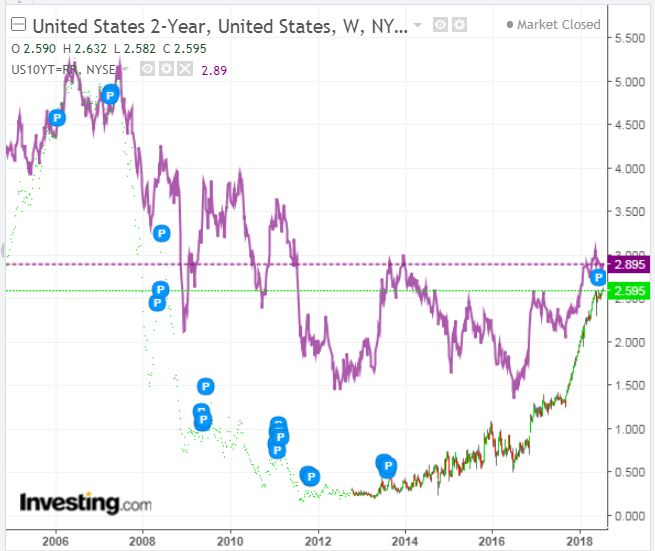
US10YT Weekly Chart
UST10Y Chart

The next (longer-term) percentage comparison chart shows the weakness that ensued in the S&P 500 when the 2-YT crossed below the 10-YT.

S&P 500

The following (short-term) percentage comparison chart shows that the 10-YT gained more this past week than the 2-YT.

Percentage Comparison Chart

Keep an eye on whether last week's outperformance of the 10-YT was just an anomaly, or whether it may be a signal of a potential tightening of the spread between it and the 2-YR. If we see a continued narrowing of this spread, it may signal bad news for U.S. bank stocks, and, potentially, the SPX.

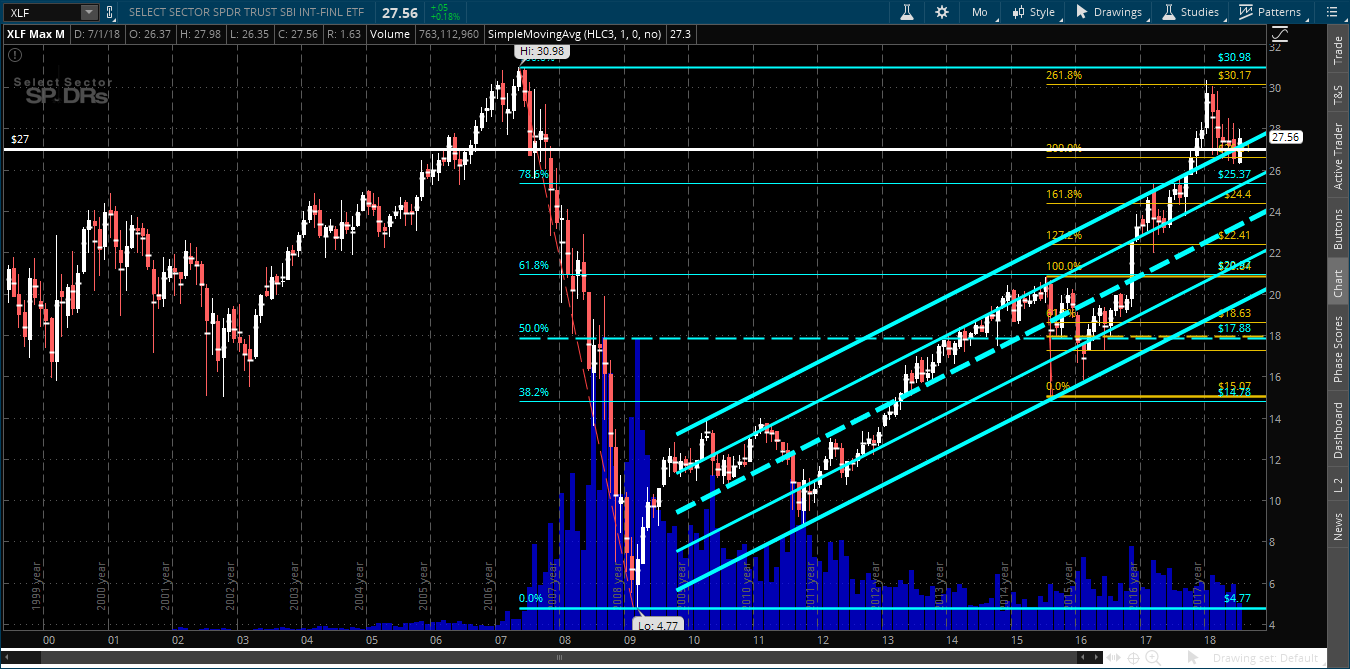
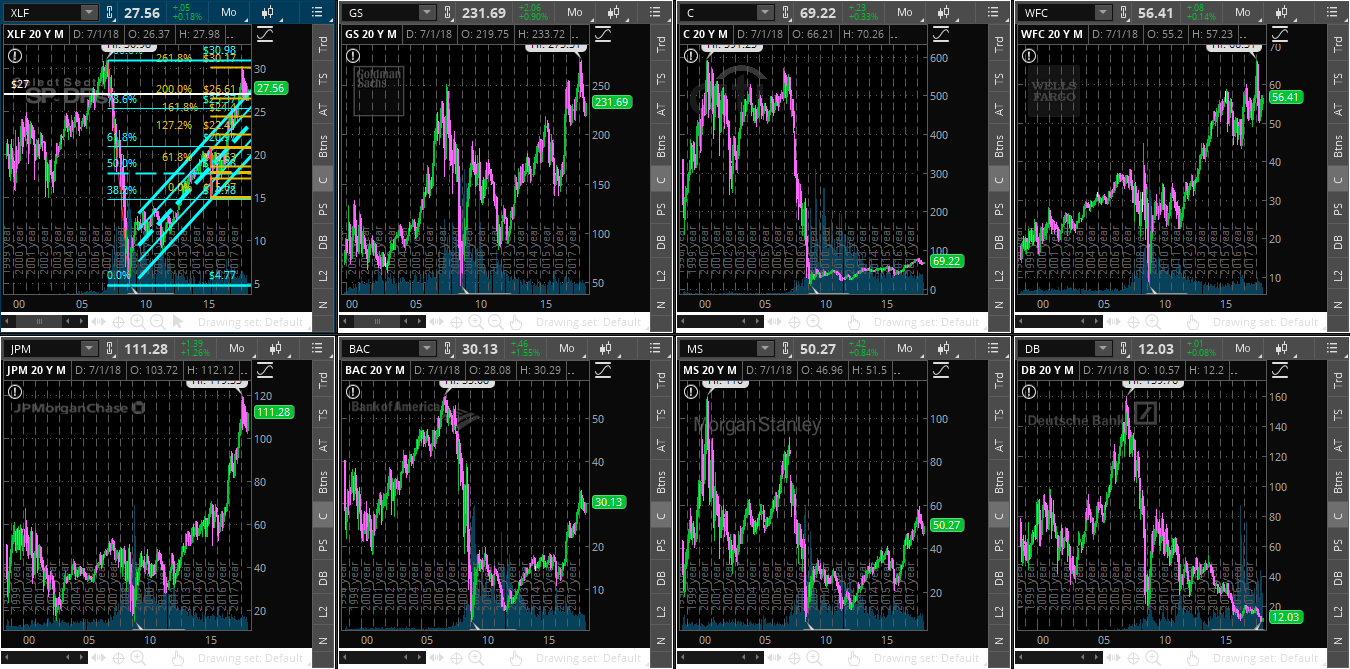
At the moment, the Financials ETF (Financial Select Sector SPDR (NYSE:XLF)) is hovering just above major support at 27.00, as shown on the following monthly chart, and the banks stocks are stuck in their respective consolidation zones, as shown on the last monthly chartgrid.

Watch for signs of weakness if:

  • XLF drops and holds below 27.00,
  • bank stocks break and hold below their congestion zones, and
  • the spread narrows between the above-mentioned 2 and 10-YR yields.


On a more ominous note, if, longer term, we see a crossover of the 2-YR below the 10-YR on accelerating momentum, we'll likely get quite an equity market downturn.
Equity Market
XLF

Latest comments

Risk Disclosure: Trading in financial instruments and/or cryptocurrencies involves high risks including the risk of losing some, or all, of your investment amount, and may not be suitable for all investors. Prices of cryptocurrencies are extremely volatile and may be affected by external factors such as financial, regulatory or political events. Trading on margin increases the financial risks.
Before deciding to trade in financial instrument or cryptocurrencies you should be fully informed of the risks and costs associated with trading the financial markets, carefully consider your investment objectives, level of experience, and risk appetite, and seek professional advice where needed.
Fusion Media would like to remind you that the data contained in this website is not necessarily real-time nor accurate. The data and prices on the website are not necessarily provided by any market or exchange, but may be provided by market makers, and so prices may not be accurate and may differ from the actual price at any given market, meaning prices are indicative and not appropriate for trading purposes. Fusion Media and any provider of the data contained in this website will not accept liability for any loss or damage as a result of your trading, or your reliance on the information contained within this website.
It is prohibited to use, store, reproduce, display, modify, transmit or distribute the data contained in this website without the explicit prior written permission of Fusion Media and/or the data provider. All intellectual property rights are reserved by the providers and/or the exchange providing the data contained in this website.
Fusion Media may be compensated by the advertisers that appear on the website, based on your interaction with the advertisements or advertisers.
© 2007-2024 - Fusion Media Limited. All Rights Reserved.