
The US posted the lowest trade deficit in 18 months driven by increases in exports and declines in imports, particularly due to lower oil prices.
WSJ: - The U.S. trade deficit with other countries narrowed to $42.9 billion in June from $48 billion a month earlier, the Commerce Department said Thursday, as imports fell and exports grew. Exports, which have been a pivotal contributor to the economic recovery, were strong almost everywhere except to Europe, where a recession and a protracted sovereign-debt crisis have sapped demand.
Europe's lackluster appetite for U.S. goods was more than countered by countries such as China, where reliance on U.S. exports continues to expand, even as that economy has slowed from double-digit growth. 
In June, the U.S. notched increases in exports of a variety of goods including pharmaceuticals, cars and industrial engines. Exports increased $1.7 billion to $185 billion, the highest monthly tally ever. Imports declined $3.5 billion to $227.9 billion, driven largely by a drop in oil prices that reduced the value of petroleum imports. Total U.S. exports are up 6% in the first six months of 2012 from the same period a year ago. In the first half of 2011, they were up 16% from the year-earlier period.
This improvement was unexpected and is likely unsustainable given broad weakness across emerging markets countries. Nevertheless the US was helped by a diversified portfolio of export markets.
On the other hand the UK posted the worst trade deficit in at least 15 years.
WSJ: - The U.K.posted its largest overall trade deficit since comparable records began 15 years ago, indicating that weak demand for British goods, in Europe and beyond, is hampering the country's efforts to trade its way out of recession.
The U.K.'s world goods trade deficit—which, with the services trade balance, makes up the overall trade balance—widened more than expected to £10.1 billion ($15.82 billion) in June from £8.4 billion in May, the biggest deficit since September 2011, figures from the Office for National Statistics showed Thursday.
The explanation has to do (at least in large part) with the UK's dependence on the Eurozone for exports, which is not as pronounced for the US.
The Telegraph: - The trade in goods deficit jumped to a record £10.1bn in June from £8.4bn in May after the eurozone crisis drove an 8.4pc fall in exports. The collapse in exports far outpaced a 1.2pc fall in imports, the Office for National Statistics said.
What is making it particularly difficult for the UK is the strength of the British pound versus the euro (discussed here) - as UK goods look relatively expensive in the Eurozone. 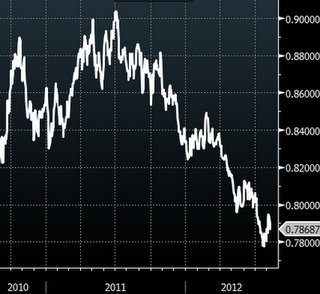 EUR/GBP" title="EUR/GBP" width="320" height="294">
This sharp divergence between the US and the UK trade balance numbers (chart below) is yet another example of the the impact the Eurozone is having on global economies.
- English (UK)
- English (India)
- English (Canada)
- English (Australia)
- English (South Africa)
- English (Philippines)
- English (Nigeria)
- Deutsch
- Español (España)
- Español (México)
- Français
- Italiano
- Nederlands
- Português (Portugal)
- Polski
- Português (Brasil)
- Русский
- Türkçe
- العربية
- Ελληνικά
- Svenska
- Suomi
- עברית
- 日本語
- 한국어
- 简体中文
- 繁體中文
- Bahasa Indonesia
- Bahasa Melayu
- ไทย
- Tiếng Việt
- हिंदी
US, UK Trade Balance Trends Diverge Sharply
Published 08/10/2012, 03:28 AM
Updated 07/09/2023, 06:31 AM
US, UK Trade Balance Trends Diverge Sharply
3rd party Ad. Not an offer or recommendation by Investing.com. See disclosure here or
remove ads
.
Latest comments
Install Our App
Risk Disclosure: Trading in financial instruments and/or cryptocurrencies involves high risks including the risk of losing some, or all, of your investment amount, and may not be suitable for all investors. Prices of cryptocurrencies are extremely volatile and may be affected by external factors such as financial, regulatory or political events. Trading on margin increases the financial risks.
Before deciding to trade in financial instrument or cryptocurrencies you should be fully informed of the risks and costs associated with trading the financial markets, carefully consider your investment objectives, level of experience, and risk appetite, and seek professional advice where needed.
Fusion Media would like to remind you that the data contained in this website is not necessarily real-time nor accurate. The data and prices on the website are not necessarily provided by any market or exchange, but may be provided by market makers, and so prices may not be accurate and may differ from the actual price at any given market, meaning prices are indicative and not appropriate for trading purposes. Fusion Media and any provider of the data contained in this website will not accept liability for any loss or damage as a result of your trading, or your reliance on the information contained within this website.
It is prohibited to use, store, reproduce, display, modify, transmit or distribute the data contained in this website without the explicit prior written permission of Fusion Media and/or the data provider. All intellectual property rights are reserved by the providers and/or the exchange providing the data contained in this website.
Fusion Media may be compensated by the advertisers that appear on the website, based on your interaction with the advertisements or advertisers.
© 2007-2024 - Fusion Media Limited. All Rights Reserved.