
Urban Outfitters Inc (NASDAQ:URBN). URBN reported sturdy second-quarter fiscal 2022 results wherein the top and the bottom line outshone the Zacks Consensus Estimate and also improved on a year-over-year basis. We note that sales across the company’s all brands and segments grew year over year.
The flourishing digital channel in North America witnessed mid-double-digit sales growth. Overall, the company’s digital performance was impressive. Its FP Movement delivered another sturdy quarter with the overall brand revenues increasing more than 200%. At present, the brand operates 54 shop-in-shop locations inside Free People Collection outlets and 13 stand-alone stores. Markedly, these stand-alone stores are performing outstandingly. In the reported quarter, the Movement’s customer base grew more than 80% year over year and above 300% from the second-quarter 2020 reading.
The Nuuly brand recently announced the launch of its sister brand Nuuly Thrift. This is a resale marketplace where customers can buy or sell women's, men's or kids apparel and accessories through the iOS device. The Nuuly team will launch its app later this fall.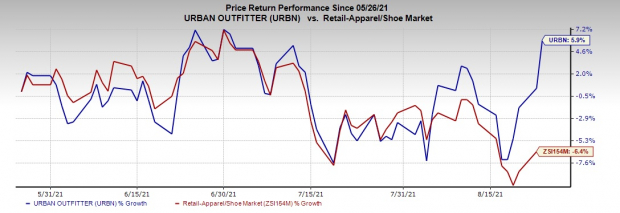
Image Source: Zacks Investment Research
Over the past three months, this currently Zacks Rank #3 (Hold) stock has gained 5.9% against the industry’s 6.4% decline.
Deeper Insight
This lifestyle-specialty retail company delivered earnings per share of $1.28 that beat the Zacks Consensus Estimate of 79 cents. The bottom line improved significantly from 35 cents recorded in the year-ago quarter and 61 cents earned in the quarter ended Jul 31, 2019.
In the reported quarter, net sales of $1,157.7 million soared 44.1% year over year and surpassed the Zacks Consensus Estimate of $1,080 million. Also, the metric grew 20.3% from the figure reported in the quarter ended Jul 31, 2019. Brandwise, net sales were up 36.3% year over year to $441.6 million at Urban Outfitters, 52.7% to $450.6 million at Anthropologie Group and 40.3% to $249.7 million at Free People. Menus & Venues’ net sales amounted to $5.9 million, significantly up from $1.6 million recorded in the prior-year quarter. Nuuly, the subscription-based rental service for women’s clothes contributed $9.9 million to net sales, reflecting an increase 110.6% from the year-ago period’s level.
Urban Outfitters, Inc. Price, Consensus and EPS Surprise

Urban Outfitters, Inc. price-consensus-eps-surprise-chart | Urban Outfitters, Inc. Quote
Segmentwise, net sales at the company’s Retail Segment surged 43.8% year over year to $1,089 million while the same at the Wholesale Segment climbed 43.1% to $58.8 million. Comparable Retail segment net sales rose 40% year over year and 22% from the same-quarter fiscal 2020 level on account of double-digit sales growth across the digital channel. Growth was partly offset by low single-digit negative retail store sales on lower store traffic. Robust consumer demand in majority of the product categories, mainly apparel, as well as solid execution drove double-digit retail segment comps across all brands.
When compared to the quarter ended Jul 31, 2019, comparable Retail segment net sales jumped 53% at the Free People Group, 14% at the Anthropologie Group and 20% at Urban Outfitters.
An Insight Into Margins
In the quarter under review, gross profit soared 82.9% year over year to $435.3 million from the year-ago quarter’s level. Also, gross margin expanded 800 basis points (bps) year over year and 478 bps from the second-quarter fiscal 2020 tally to 37.6%. Record low merchandise markdown rates in the Retail segment coupled with leveraged store occupancy expenses on higher penetration of the digital channel in Retail segment net sales aided the gross margin.
Selling, general and administrative (SG&A) expenses shot up 59.8% year over year and 13.3% from the second-quarter fiscal 2020 level to $269.4 million. As a percentage of net sales, the metric increased 230 bps year over year while the same decreased 140 bps from the fiscal 2020 figure to 23.3%.
The company recorded an operating income of $165.9 million, significantly up from $69.4 million recorded in the prior-year quarter and $78.1 million reported in second-quarter fiscal 2019. As a rate of sales, operating margin expanded 570 bps year over year and 620 bps from the quarter ended Jul 31, 2019 to 14.3%.
Store Update
During the six months ended Jul 31, 2021, the company opened 28 retail outlets including nine Urban Outfitters, four Anthropologie Group stores and 15 Free People Group stores (including seven FP Movement stores). Also, one Urban Outfitters franchisee-owned store and one Anthropologie Group franchisee-owned outlet were inaugurated during the aforementioned period. It shuttered two Free People Group stores, two Anthropologie Group outlets and one each of Urban Outfitters store and Menus & Venues restaurant.
As of Jul 31, 2021, the company operated 255 Urban Outfitters stores in the United States, Canada and Europe; 239 Anthropologie Group stores in the United States, Canada and Europe; 162 Free People stores in the United States, Canada and Europe; 10 Menus & Venues restaurants; two Urban Outfitters franchisee-owned stores and one Anthropologie Group franchisee-owned store.
For the second half of fiscal 2022, management plans to open about 26 stores and close 11 outlets. This store opening number does not reflect franchise partner locations across the international markets. It also intends to open additional six Movement stores in the rest of fiscal 2022 and 15-20 stores in fiscal 2023.
Other Financial Details
Urban Outfitters ended the quarter with cash and cash equivalents of $464.8 million and total shareholders’ equity of $1,669.4 million. As of Jul 31, 2021, total inventory increased 37.3% year over year to $483.1 million.
This Philadelphia, PA-based company generated net cash of $195.2 million from operating activities during the first half of fiscal 2022. For fiscal 2022, management projects capital expenditures of nearly $285 million, mainly related to expanded distribution and fulfillment capacity to boost digital growth and store launches.
Urban Outfitters did not buy back shares in the first six months of fiscal 2022. It repurchased and subsequently retired 0.5 million shares for roughly $7 million in fiscal 2021. As of Jul 31, 2021, the company had 25.9 million shares remaining under its share repurchase programs.
Outlook
Management highlighted that comp sales in August at the Free People and Anthropologie brands are almost in line with the reported quarter’s levels while Urban Outfitters’ brand comps slowed down in mid-July. The company expects retail segment comps for the Urban Outfitters’ brand in the fiscal third quarter to moderate by high single-digits. August to date, the overall Urban Outfitters retail segment comp sales are mid-teens positive.
Urban Outfitters projects the fiscal third quarter to continue reflecting a healthy sales improvement in comparison to fiscal 2020. It believes that retail segment comp sales will grow in mid teens while the wholesale segment sales are likely to decline at a rate similar to that of the fiscal second quarter. These will result in the overall company sales in low double-digits.
The company’s gross margins for the fiscal third quarter are likely to improve 100 bps from the fiscal 2020 figure, given the current sales performance and forecast. Lower markdown rates on solid consumer demand, robust product performance and disciplined inventory control aid the gross margin. Favorable markdowns are likely to offset reduced initial mark-ups, and deleveraged delivery and logistics expenses. SG&A for the fiscal third quarter is likely to grow at a rate just below the sales growth rate.
More Hot Stocks in Retail
Abercrombie ANF has a long-term earnings growth rate of 18% and a Zacks Rank #1 (Strong Buy), currently. You can see the complete list of today’s Zacks #1 Rank stocks here.
Gap GPS, presently a Zacks #1 Ranked stock, has a long-term earnings growth rate of 12%.
Hibbett HIBB has a long-term earnings growth rate of 17.7% and a Zacks Rank of 1 at present.
Time to Invest in Legal Marijuana
If you’re looking for big gains, there couldn’t be a better time to get in on a young industry primed to skyrocket from $17.7 billion back in 2019 to an expected $73.6 billion by 2027.
After a clean sweep of 6 election referendums in 5 states, pot is now legal in 36 states plus D.C. Federal legalization is expected soon and that could be a still greater bonanza for investors. Even before the latest wave of legalization, Zacks Investment Research has recommended pot stocks that have shot up as high as +285.9%.
You’re invited to check out Zacks’ Marijuana Moneymakers: An Investor’s Guide. It features a timely Watch List of pot stocks and ETFs with exceptional growth potential.
Today, Download Marijuana Moneymakers FREE >>Want the latest recommendations from Zacks Investment Research? Today, you can download 7 Best Stocks for the Next 30 Days. Click to get this free report
Abercrombie & Fitch Company (ANF): Free Stock Analysis Report
The Gap, Inc. (GPS): Free Stock Analysis Report
Urban Outfitters, Inc. (URBN): Free Stock Analysis Report
Hibbett, Inc. (HIBB): Free Stock Analysis Report
To read this article on Zacks.com click here.
Zacks Investment Research