
Univar Inc. (NYSE:UNVR) logged a profit (on a reported basis) of $16.3 million or 10 cents per share in second-quarter 2019, down around 71% from a profit of $56.1 million or 40 cents a year ago. The bottom line in the reported quarter includes integration and transaction related costs associated with the company's acquisition of Nexeo Solutions.
Barring one-time items, earnings were 42 cents a share in the quarter, down from 47 cents a year ago. The results missed the Zacks Consensus Estimate of 44 cents.
The chemical maker’s revenues were $2,584.6 million in the quarter, up 9% year over year. It, however, lagged the Zacks Consensus Estimate of $2,810.2 million.
On a constant currency basis, revenues rose around 11% year over year. Gains in the company’s U.S. business was masked by a soft Canadian agriculture sector and weaker demand for chemicals and ingredients from global industrial end markets.
Univar Inc. Price, Consensus and EPS Surprise
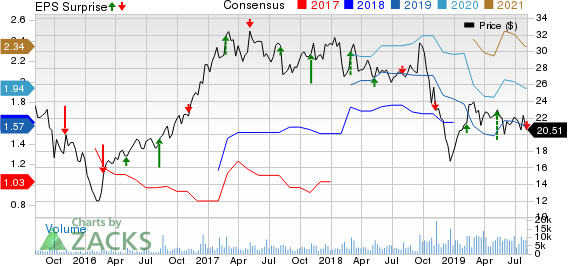
Univar Inc. price-consensus-eps-surprise-chart | Univar Inc. Quote
Segment Review
Revenues at the USA division shot up around 21% year over year on a reported basis to $1,628.7 million in the quarter, driven by the Nexeo acquisition and better sales force execution. Gross profit rose around 29% year over year, helped by favorable product and end-market mix.
Revenues at the Canada segment dropped roughly 10% year over year to $406.5 million. Gross profit was flat year over year in the quarter. The segment witnessed strong performance in the industrial chemical business and certain commodity products. This was, in part, offset by lower volumes due to a weak agriculture sector.
The EMEA segment raked in sales of $458.9 million, down around 11% year over year. Gross profit was down around 7% year over year.
Sales from the LATAM unit rose roughly 17% to $116.6 million. Gross profit rose around 8% year over year. The segment gained from the Nexeo acquisition, strong performance in Mexico energy markets and the Brazilian agriculture sector and cost control actions, partly offset by weak industrial demand.
Balance Sheet
Univar ended the quarter with cash and cash equivalents of $109.5 million, down around 15% year over year. Long-term debt was $3,117.1 million, up around 20% year over year.
Outlook
For 2019, Univar has revised its adjusted EBITDA forecast factoring in lower-than-expected demand for chemicals and ingredients, higher expected net cost synergies from Nexeo and outlook from many supplier partners. The company now sees adjusted EBITDA of between $725 million and $740 million, compared with its prior view of $740 million and $760 million.
Univar is progressing well with the integration of Nexeo's chemical distribution customers, suppliers and support functions. The company now sees higher cost saving synergies from Nexeo than what it had originally anticipated. It has raised its guidance for annual net synergy from $100 million to $120 million (before tax). Univar expects to achieve $20 million in net synergies this year, higher than its initial expectations of $10 million.
The company also expects to generate $275-$325 million in free cash flow in 2019.
Moreover, Univar expects adjusted EBITDA of between $180 million and $190 million for the third quarter of 2019, up from $157 million it earned a year ago.
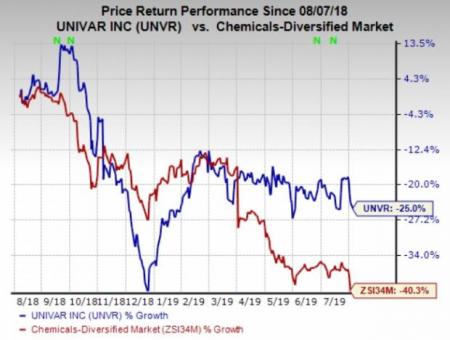
Price Performance
Univar’s shares have lost around 25% over a year compared with the roughly 40.3% decline recorded by its industry.
Zacks Rank & Key Picks
Univar currently carries a Zacks Rank #4 (Sell).
Better-ranked stocks worth considering in the basic materials space include SSR Mining Inc. (NASDAQ:SSRM) , Kinross Gold Corporation (NYSE:KGC) and Flexible Solutions International Inc (NYSE:FSI) .
SSR Mining has an estimated earnings growth rate of 134.8% for the current year and carries a Zacks Rank #1 (Strong Buy). Its shares have rallied 63% in the past year. You can see the complete list of today’s Zacks #1 Rank stocks here.
Kinross has projected earnings growth rate of 110% for the current year and carries a Zacks Rank #1. The company’s shares have gained 44% in a year’s time.
Flexible Solutions has an expected earnings growth rate of 342.9% for the current fiscal year and carries Zacks Rank #2 (Buy). Its shares have surged around 104% in the past year.
The Hottest Tech Mega-Trend of All
Last year, it generated $8 billion in global revenues. By 2020, it's predicted to blast through the roof to $47 billion. Famed investor Mark Cuban says it will produce "the world's first trillionaires," but that should still leave plenty of money for regular investors who make the right trades early.
See Zacks' 3 Best Stocks to Play This Trend >>
Univar Inc. (UNVR): Free Stock Analysis Report
Flexible Solutions International Inc. (FSI): Free Stock Analysis Report
Kinross Gold Corporation (KGC): Free Stock Analysis Report
Silver Standard Resources Inc. (SSRM): Free Stock Analysis Report
Original post
Zacks Investment Research