
United Rentals Inc. (NYSE:URI) came up with better-than-expected results in the second quarter of 2017. The company’s earnings and revenues in the quarter also improved from the year-ago level buoyed by solid volume growth, record time utilization along with improved rate trend.
The company’s second-quarter 2017 adjusted earnings of $2.37 per share beat the Zacks Consensus Estimate of $2.31 by 2.6%. Earnings also increased 15% year over year.
Revenues
Total revenue of $1.59 billion surpassed the Zacks Consensus Estimate of $1.55 billion by 3%. Revenues increased 12.4% year over year.
Rental revenues were also up 13.5% from the year-ago quarter to $1.37 billion. Volume of equipment on rent increased 17.4%, while rental rates fell 1.2%.
Segment Discussion
General Rentals: Segment rental revenues increased 12.6% year over year to $1.14 billion. Segment equipment rentals’ gross profit increased 11.6% to $465 million. However, gross margin declined 40 basis points (bps) year over year.
Trench, Power and Pump: The company’s Trench, Power and Pump specialty segment's rental revenues rose 18.5% year over year to $224 million, primarily on a same-store basis. Segment equipment rentals gross profit rose 24.7% to $111 million and gross margin improved 250 bps year over year.
Time Utilization & Fleet Size
Time utilization increased 190 bps to 66% from the year-ago level, marking a record second quarter for the company.
The size of the rental fleet was $10.27 billion of original equipment cost as of Jun 30, 2017 compared with $8.99 billion as of Dec 31, 2016. The age of the rental fleet was 46.7 months on an OEC-weighted basis as of Jun 30, 2017 compared with 45.2 months as of Dec 31, 2016.
Margins
Total equipment rentals gross margin expanded 10 bps year over year to 42.1%.
Adjusted EBITDA was $747 million, up 10% from the second quarter of 2016. Adjusted EBITDA margin was 46.8%, down 100 bps from the prior-year quarter.
Balance Sheet
United Rentals’ cash and cash equivalents totaled $338 million as of Jun 30, 2017 compared with $312 million as of Dec 31, 2016.
In the quarter, the company generated $714 million of net cash from operating activities compared with $643 million for the same period last year. Free cash flow was $124 million, less than $165 million reported in the prior-year quarter.
2017 Guidance Updated
The company updated its 2017 outlook following the acquisition of NES Rentals.
Total revenue is now expected in the range of $6.25–$6.40 billion, higher than the prior range of $6.05–$6.25 billion.
Adjusted EBITDA is projected between $2.950 billion and $3.025 billion compared with the prior expectation of $2.835–$2.985 billion.
Net rental capital expenditures after gross purchases are likely to be in the range of $1.05–$1.15 billion, higher than $925 million to $1.075 billion expected earlier.
Net cash provided by operating activities is expected in the range of $1.975–$2.175 billion, more than $1.85 billion to $2.05 billion expected earlier.
Free cash flow is expected in the $825 million to $925 million range, higher than $800 million to $900 million expected earlier.
United Rentals, Inc. Price, Consensus and EPS Surprise
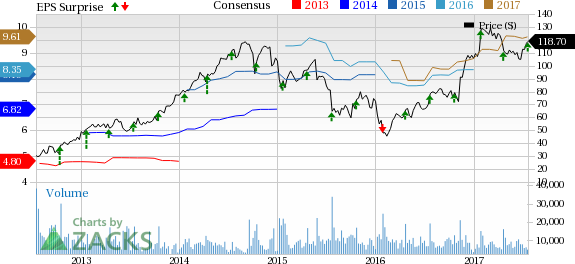
United Rentals, Inc. Price, Consensus and EPS Surprise | United Rentals, Inc. Quote
Zacks Rank
United Rentals carries a Zacks Rank #3 (Hold). You can see the complete list of today’s Zacks #1 Rank stocks here.
Upcoming Peer Releases
Owens Corning (NYSE:OC) is slated to release its quarterly results on Jul 26. The Zacks Consensus Estimate for the to-be-reported quarter is currently pegged at $1.05.
Patrick Industries, Inc. (NASDAQ:PATK) is scheduled to release its quarterly results on Jul 27. The Zacks Consensus Estimate for the to-be-reported quarter is currently pegged at $1.16.
CalAtlantic Group, Inc. (NYSE:CAA) is slated to release its quarterly results on Jul 27. The Zacks Consensus Estimate for the to-be-reported quarter is currently pegged at 78 cents.
3 Top Picks to Ride the Hottest Tech Trend
Zacks just released a Special Report to guide you through a space that has already begun to transform our entire economy...
Last year, it was generating $8 billion in global revenues. By 2020, it's predicted to blast through the roof to $47 billion. Famed investor Mark Cuban says it will produce ""the world's first trillionaires,"" but that should still leave plenty of money for those who make the right trades early. Download Report with 3 Top Tech Stocks >>
United Rentals, Inc. (URI): Free Stock Analysis Report
Owens Corning Inc (OC): Free Stock Analysis Report
CalAtlantic Group, Inc. (CAA): Free Stock Analysis Report
Patrick Industries, Inc. (PATK): Free Stock Analysis Report
Original post
Zacks Investment Research