Research Affiliates, in their May newsletter, discussed the importance of "secular stagnation" and a coming decade of low returns. How low you ask? How about 1% kind of low?
"But Lance, the markets has returned 10% on average over the last century, so RA is probably going to be wrong."
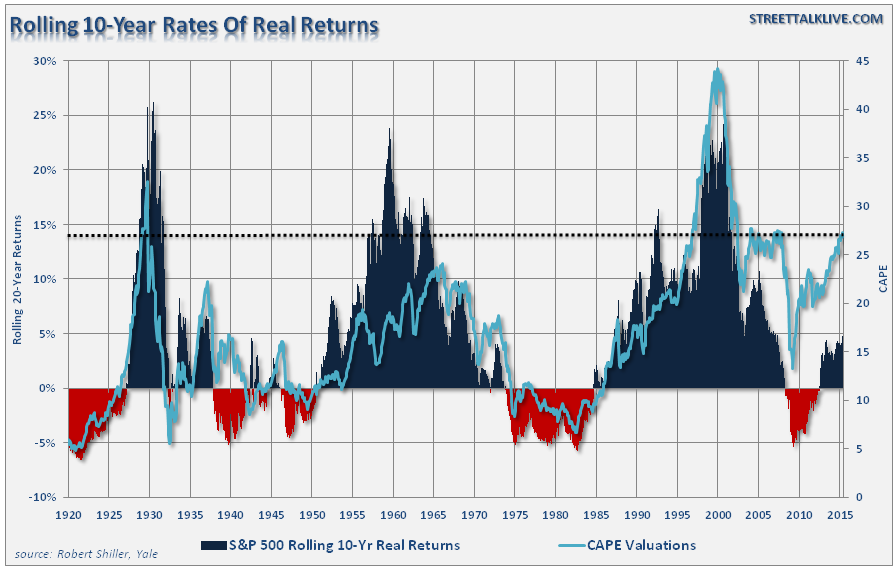
Before you dismiss RA's comments, it is important to put them into some context. When low rates of return are discussed, it is not meant that each year will be low but that the return for the entire period will be low. The chart below shows 10-year rolling REAL, inflation-adjusted, returns in the markets. (Important note: Many advisors/analysts often pen that the market has never had a 10 or 20-year negative return. That is only on a nominal basis and should be disregarded as inflation must be included in the debate.)
There are two important points to take away from the data. First, is that there are several periods throughout history where market returns were not only low, but negative. Secondly, the periods of low returns follow periods of excessive market valuations. "This time is not different."
There are two main drivers behind the concept of a "decade of low returns" - secular stagnation and valuations.
Secular Stagnation
While I have written many times in the past about the importance of secular stagnation, RA points a much finer point on the argument.
"In a world of secular stagnation, the Federal Reserve may not be able to achieve a real rate of interest low enough to match the long-run equilibrium rate of interest. Equally insidious is secular stagnation's feeling of permanence; the trends at fault are slow moving and likely to persist well past the standard business-cycle horizon.
Deleveraging from our debt overhang—a hangover from the housing bubble now infecting many central governments—will take decades. The impact of aging demographics across the developed world is only just beginning to slow both labor force growth and productivity, and this trend will only strengthen in the coming years.
Likely, we have entered a period of secular stagnation heavily impacted by lingering debt overhangs, persistent demographic shifts in savings preferences, and increased efficiency of capital...these longer-run trends, which are powerful and long lasting, and will impact our economic outlook for many years to come. Current deeply negative interest rates will likely shift back toward zero, but within our investment horizon are unlikely to return anywhere close to the historical averages. As Michael Corleone discovered, it is not easy to escape genetic or demographic destiny."
Despite optimistic views that Central Bank interventions can stimulate economic growth and inflation through monetary policies, the reality is likely quite the opposite given the massive levels of global debt.
For the markets to generate a higher level of return in the future would require substantially higher levels of real growth. This is unlikely given the aging demographic trends, productivity increases which weigh on employment and wage growth, and debt servicing that diverts dollars from productive investments. This is not just a domestic issue, but a global one.
It is interesting that even though Central Banks acknowledge that it was the ramp up in debt and leverage that led to our current economic problems, it is somehow believed that it can be resolved by simply shuffling debt from governments to central banks. Eventually, the global debt levels will have to be dealt with. Until then, economic growth, inflationary pressures and interest rates will remain at historically low levels.
Valuation
As investors we are supposed to be investing for the "long term." Therefore, we should be viewing valuations as a predictor of returns over the next 10, 15 or 20 years which is the typical investment/savings time frames for individuals. David Leonhardt penned a similar view:
"The classic 1934 textbook 'Security Analysis' – by Benjamin Graham, a mentor to Warren Buffett, and David Dodd – urged investors to compare stock prices to earnings over 'not less than five years, preferably seven or ten years.' Ten years is enough time for the economy to go in and out of recession. It’s enough time for faddish theories about new paradigms to come and go.”
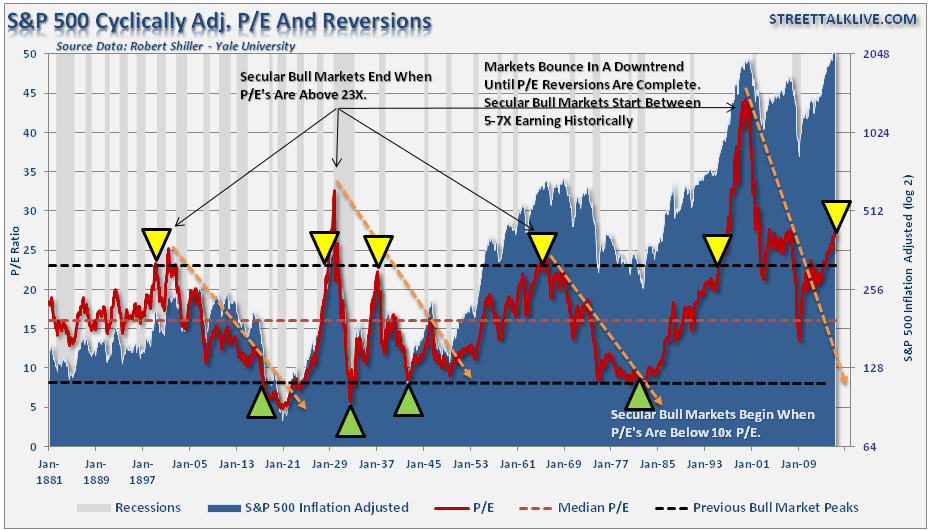
The chart below shows the long-term history of Shiller's Cyclically Adjusted P/E Ratio, which is a 10-year rolling average to smooth out short-term earnings volatility.
History shows that valuations above 23x earnings have tended to denote secular bull market peaks. Conversely, valuations at 7x earnings, or less, have tended to denote secular bull market starting points.
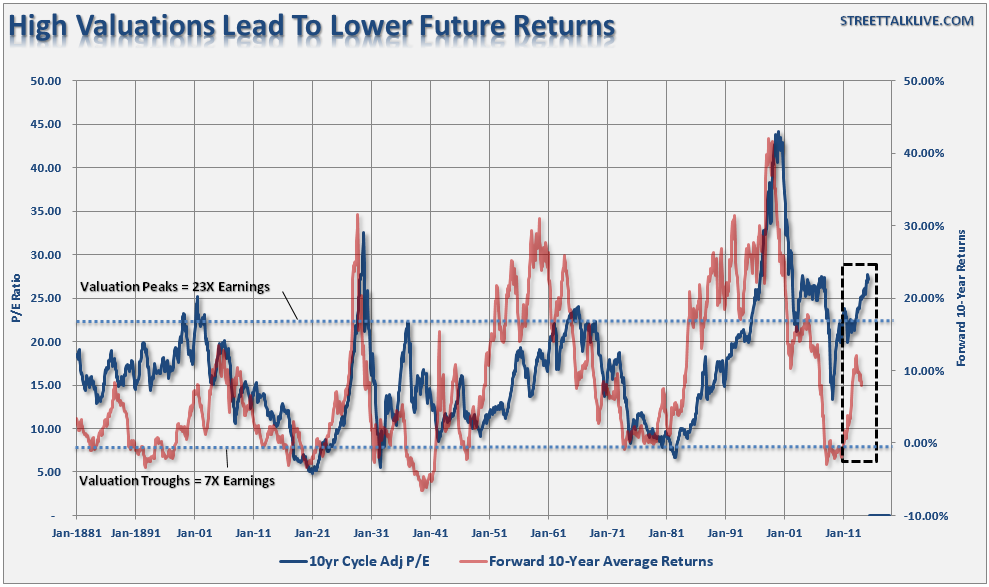
When using a relative comparison, in this case 10-years, what Shiller's data does provide is a key understanding as to what market returns should be. The chart below compares Shiller's 10-year CAPE to 10-year actual forward returns from the S&P 500.
From current levels history suggest that returns to investors over the next 10-years will likely be lower than higher. We can also prove this mathematically as well as shown.
Capital gains from markets are primarily a function of market capitalization, nominal economic growth plus the dividend yield. Using John Hussman's formula we can mathematically calculate returns over the next 10-year period as follows:
(1+nominal GDP growth)*(normal market cap to GDP ratio / actual market cap to GDP ratio)^(1/10)-1
Therefore, IF we assume that GDP could maintain 4% annualized growth in the future, with no recessions, AND IF current market cap/GDP stays flat at 1.25, AND IF the current dividend yield of roughly 2% remains, we get forward returns of:
(1.04)*(.8/1.25)^(1/10)-1+.02 = 1.5%
But there're a "whole lotta ifs" in that assumption. More importantly, if we assume that inflation remains stagnant at 2%, as the Fed hopes, this would mean a real rate of return of -0.5%. This is certainly not what investors are hoping for.
Lastly, the majority of analysis is based on the belief that individuals "bought and held" indexed based portfolios since the peak of the bull market in 1999. The problem is that in reality this is far from the truth and investors have suffered from harsh levels of capital destruction by "selling low and buying high" and loss of the singular most precious commodity of all - "time."
Since most investors have on average about 15 years to save for their retirement, the time lost in "getting back to even" is critical. As I have stated many times in the past - getting back to "even" is not an investment strategy.
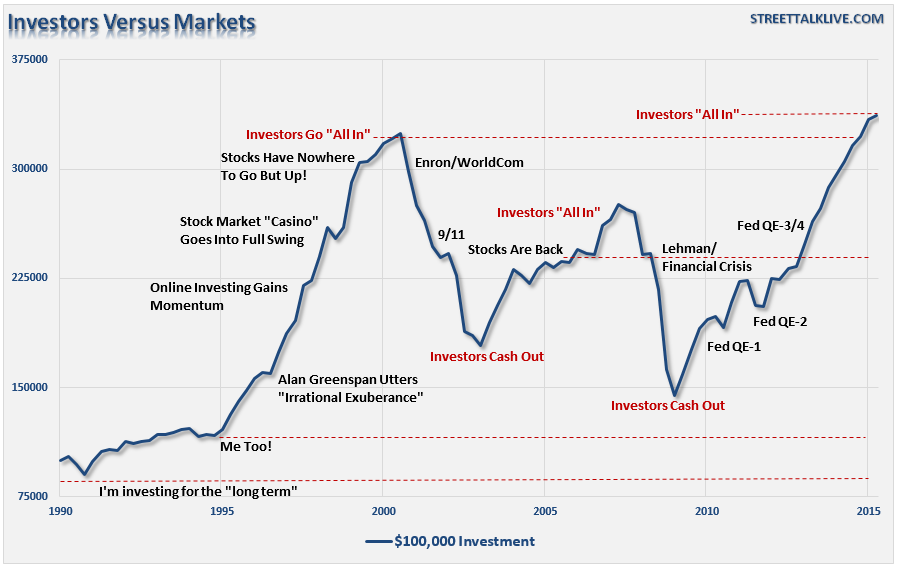
The chart below illustrates these previous two points. It is the inflation adjusted return of a $100,000 investment in the S&P 500 from 1990 to present. The reason that 1990 is important is because that is when roughly 80% of all investors today begin investing. Roughly 80% of those began after 1995. If you don't believe me, go ask 10 random people when they started investing in the financial markets and you will likely be surprised by what you find.
Unfortunately, most investors rarely do what is "logical" but react "emotionally" to market swings. When stock prices are rising instead of questioning when to "sell," they are lured in near market peaks. The reverse happens as prices fall leading first to "paralysis" and "hope" that losses will soon be recovered. Eventually, near market bottoms the emotional strain is too great and investors "dump" shares at any price to preserve what capital they have left.
Despite the media's commentary that "if an investor had 'bought' the bottom of the market..." the reality is that few, if any, actually did. The biggest drag on investor performance over time is allowing "emotions" to dictate investment decisions. This is shown in the 2014 Dalbar Investor Study, which showed "psychological factors" accounted for roughly 50% of underperformance. In other words, investors consistently bought the "tops" and sold the "bottoms."
Markets are not cheap by any measure. If earnings growth continues to wane or interest rates rise, the bull market thesis will collapse as "expectations" collide with "reality." This is not a dire prediction of doom and gloom, nor is it a "bearish" forecast. It is just a function of how markets work over time.
For investors, understanding potential returns from any given valuation point is crucial when considering putting their "savings" at risk. Risk is an important concept as it is a function of "loss". The more risk that is taken within a portfolio, the greater the destruction of capital will be when reversions occur.
This time is "not different." The only difference will be what triggers the next valuation reversion when it occurs. If the last two bear markets haven't taught you this by now, I am not sure what will. Maybe three times really is a "charm."


