The markets were seen trading a bit subdued in yesterday's session. The US dollar managed to hold its ground amid a quiet trading day. Oil prices were seen trading mixed as OPEC reported that crude oil supply declined 0.46% during the month of October. The report showed that demand for oil could increase in 2017 and 2018. However, oil prices were little changed towards the end of the day.
Looking ahead, the UK's monthly inflation figures will be published today. According to the median estimates, headline inflation rate is expected to surpass the 3% rise seen last month to 3.2% while core inflation rate is also expected to have increased 2.9%.
Among the central bank speeches lined up today, the ECB President Mario Draghi, BoE's Carney and BoJ's Kuroda are expected to speak over the day culminating with the speech from the Fed chair Janet Yellen.
EUR/USD Intraday Analysis

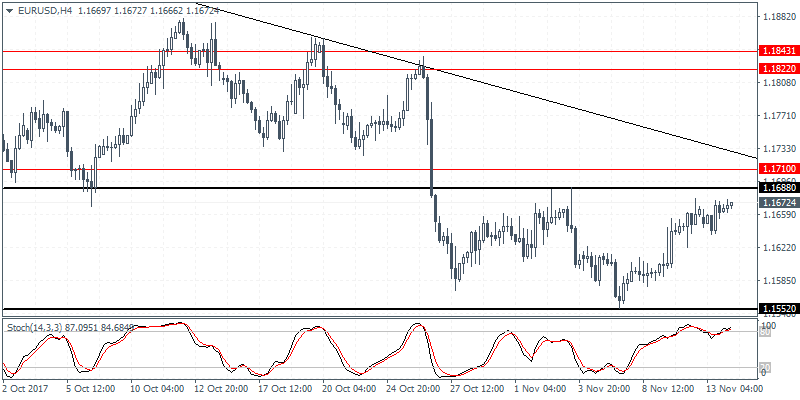
EUR/USD (1.1672): The EUR/USD has been inching higher gradually over the past four sessions. Price action remains steady near the main resistance level of 1.1672 region. The rally back to this level invalidates the bearish flag pattern. The bounce off the support level near 1.1552 suggests that EUR/USD could remain caught in the range. However, a breakout above 1.1688 couldsuggest a retracement in price with further gains expected above this level. To the downside, the risks are limited unless EUR/USD manages to breach past the previous support level that has been established.
USD/JPY Intraday Analysis

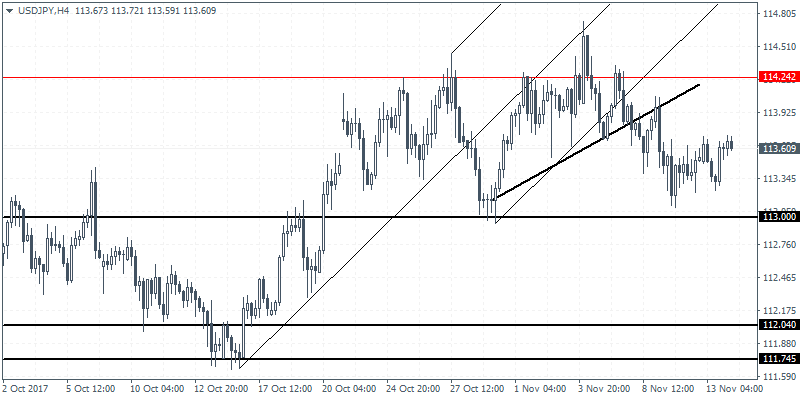
USD/JPY (113.60): The USD/JPY continues to remain trading flat with price action seen hovering near the breakout level from the rising wedge pattern formed on the daily chart. With price failing to breakout from the resistance level near 114.31 - 114.07 we expect the consolidation to continue near this level. Support is seen at 113.00 which could be tested in the near term. The BoJ Governor Kuroda is expected to speak today followed by the quarterly GDP numbers coming out from Japan. These events could potentially bring some volatility to the currency pair and help establish a short-term direction in the currency pair.
XAU/USD Intraday Analysis

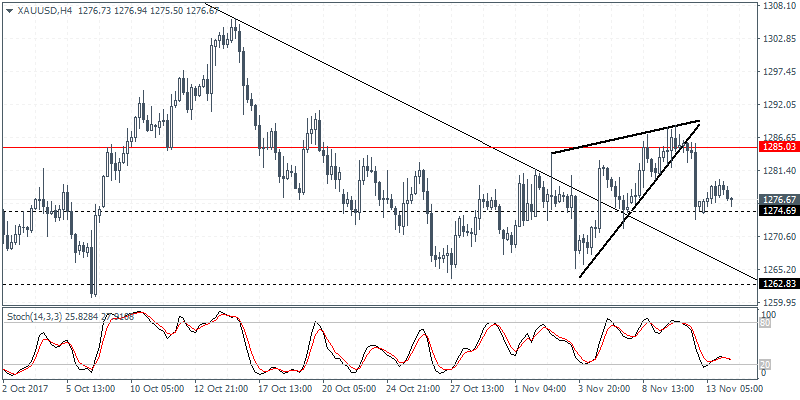
XAU/USD (1276.67): Gold prices posted a modest bounce off the initial test of support near 1274.70. However, the bounce was short lived as price action was seen falling back to this level. We expect that further downside is possible on a breakdown below the 1274.70 support. This will push gold prices lower towards the 1270.00 handle. Alternately, in the event that the support level holds out, gold prices could remain trading sideways. Further direction could be established on a breakout above 1285.00 to the upside and below 1274.70 support.
