Get 40% Off
⚠ Earnings Alert! Which stocks are poised to surge?
See the stocks on our ProPicks radar. These strategies gained 19.7% year-to-date.
Unlock full list

UK 100 – Running Out Of Steam Again?

Published 02/21/2017, 12:38 AM
Updated 03/05/2019, 07:15 AM

As the UK100 (FTSE 100) approaches the record highs that were hit back in the middle of January, there are signs that the rally is starting to run out of steam which may suggest that the gains – which have been largely built on the pounds weakness and commodity rally – may have reached a near term peak.

The rally itself over the course of the last few weeks has been very gradual in nature, as has been the case in equity markets elsewhere, but as we once again move above 7,300, the momentum indicators at the bottom of the chart are throwing up red flags.
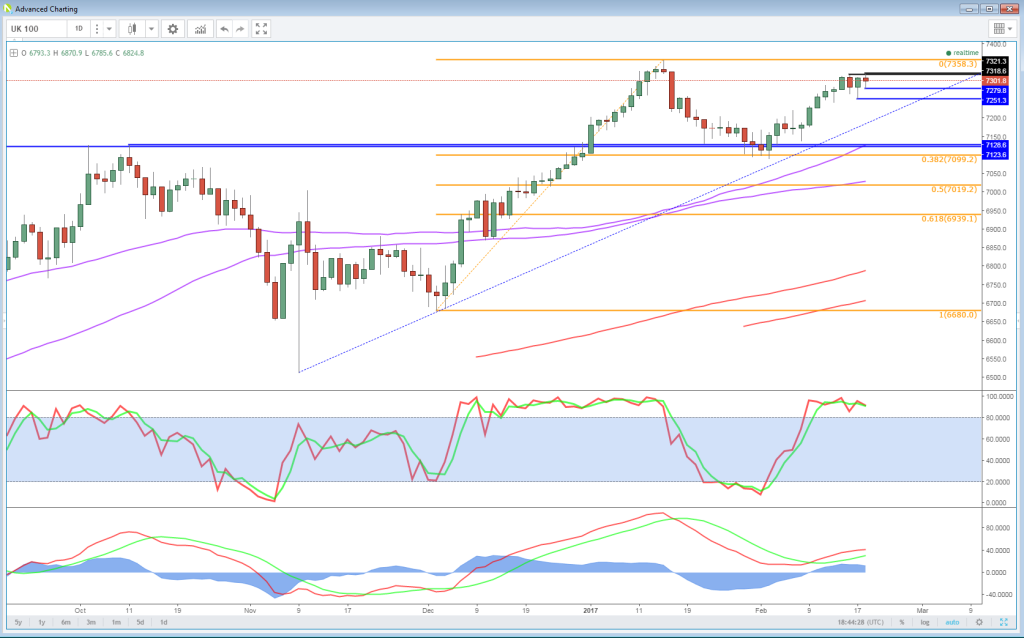
UK 100 Daily Chart

This isn’t quite as clear on the daily chart, although there has been a clear drop in the moving averages on the MACD despite the index trading only just below the January highs. The drop off in momentum though is much clearer on the 4-hour chart and is actually more focused on the near term action as we’ve approached those January levels.

Having hit a new high earlier in today’s session (just), the UK100 once again pulled back and the MACD, both the histogram and MAs, and the stochastic displayed clear negative divergence with price. The fact that this happened as we also near the previously mentioned all-time high gives further possible reason to why this happened.
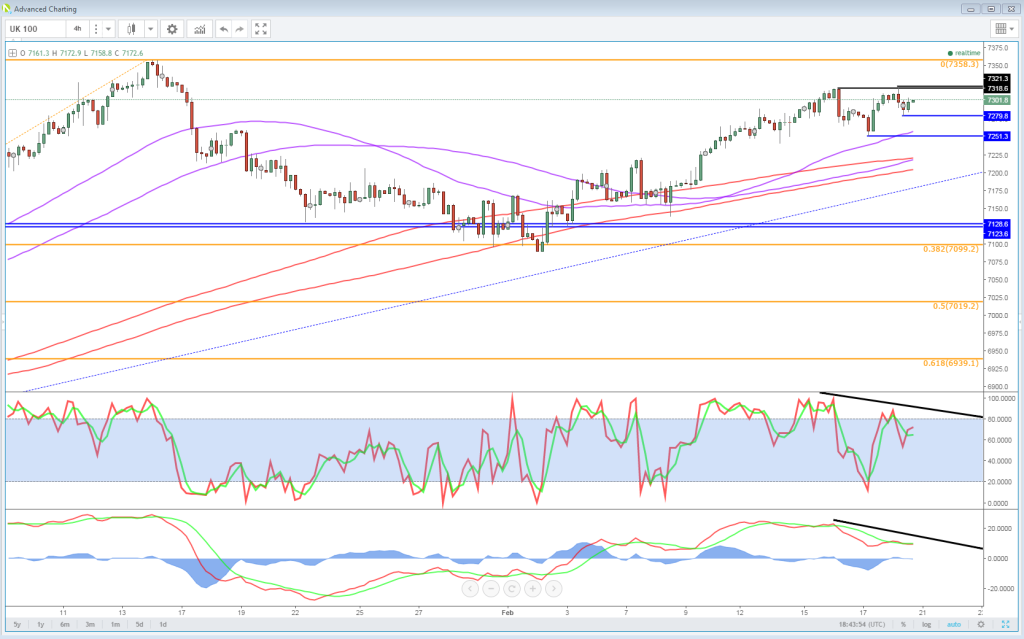
UK 100 4 Hourly Chart

The result is that we may be seeing the index failing to make a new record high from a longer term perspective and the short term rally running out of legs. This brings two important levels into consideration. To the upside, 7,318-7,321 in an important resistance and if the rally is going to be sustained into those record highs, the momentum indicators may need to confirm what’s happening on the chart.

To the downside, 7,250 marks the possible neckline of a double top on the 4-hour chart, a break of which would be quite bearish and, based on the size of the formation, could trigger a move back towards the 7,180 region.

Original post

Latest comments

Risk Disclosure: Trading in financial instruments and/or cryptocurrencies involves high risks including the risk of losing some, or all, of your investment amount, and may not be suitable for all investors. Prices of cryptocurrencies are extremely volatile and may be affected by external factors such as financial, regulatory or political events. Trading on margin increases the financial risks.
Before deciding to trade in financial instrument or cryptocurrencies you should be fully informed of the risks and costs associated with trading the financial markets, carefully consider your investment objectives, level of experience, and risk appetite, and seek professional advice where needed.
Fusion Media would like to remind you that the data contained in this website is not necessarily real-time nor accurate. The data and prices on the website are not necessarily provided by any market or exchange, but may be provided by market makers, and so prices may not be accurate and may differ from the actual price at any given market, meaning prices are indicative and not appropriate for trading purposes. Fusion Media and any provider of the data contained in this website will not accept liability for any loss or damage as a result of your trading, or your reliance on the information contained within this website.
It is prohibited to use, store, reproduce, display, modify, transmit or distribute the data contained in this website without the explicit prior written permission of Fusion Media and/or the data provider. All intellectual property rights are reserved by the providers and/or the exchange providing the data contained in this website.
Fusion Media may be compensated by the advertisers that appear on the website, based on your interaction with the advertisements or advertisers.
© 2007-2024 - Fusion Media Limited. All Rights Reserved.