
Driven by high net interest income, U.S. Bancorp (NYSE:USB) reported a positive surprise of 1.2% in second-quarter 2017. The company reported earnings per share of 85 cents, beating the Zacks Consensus Estimate by a penny. Results also came ahead of the prior-year quarter earnings of 83 cents.
Also, shares of U.S. Bancorp gained more than 2% in the pre-market session, indicating that investors have been bullish on the results. The price reaction during the full trading session will give a fair idea about the extent of satisfaction among investors.
Rising interest-rate environment aided the bank’s interest income. Further, elevated average loans and deposits balances were tailwinds. Steady capital deployment activities reflected a strong capital position. However, escalating expenses and provisions were undermining factors.
Net income was $1.5 billion, down 1.4% year over year.
Revenue, Loans & Deposits Growth Recorded, Costs & Provisions Escalate
U.S. Bancorp’s net revenue came in at around $5.49 billion in the quarter, up around 1% year over year. The increase in net interest income was mostly offset by lower non-interest income. Moreover, revenues surpassed the Zacks Consensus Estimate of $5.46 billion.
U.S. Bancorp’s tax-equivalent net interest income totaled $3.1 billion in the quarter, up 5.9% from the prior-year quarter. The rise was mainly due to loan growth and rising interest rates.
Average earning assets climbed 4.8% year over year, supported by growth in average total loans and average investment securities, along with elevated average cash balances. Further, net interest margin of 3.04% was up 2 basis points year over year, driven by higher interest rates. Loan portfolio mix, reduced reinvestment rates on maturing securities and elevated cash balances partially mitigated rise in margins.
U.S. Bancorp’s non-interest income moved down 5.2% on a year-over-year basis to $2.4 billion. The decline was primarily due to lower commercial products revenue, mortgage banking revenue and other non-interest income.
Provision for credit losses increased 7.0% year over year to $350 million in the reported quarter.
U.S. Bancorp’s average total loans increased 3.4% year over year to $275.5 billion. The growth was stemmed by a rise in commercial loans, residential mortgages, total other retail and credit card loans. These increases were partially offset by a drop in commercial real estate and covered loans. Excluding covered loans, average total loans rose 3.7% year over year.
Average total deposits were up 7.7% from the prior-year quarter to $331.2 billion. The upsurge was due to growth in non-interest-bearing deposits, as well as interest-bearing deposits.
Non-interest expenses rose 1.0% year over year to $3.0 billion at U.S. Bancorp. The upsurge in mostly all components of non-interest expenses was partially offset by lower employee benefits and other intangibles.
Deteriorating Credit Quality
Credit metrics at U.S. Bancorp deteriorated in the reported quarter. Net charge-offs came in at $340 million, up 7.3% year over year. On a year-over-year basis, the company experienced deterioration, mainly in net charge-offs in the credit card segment.
Total allowance for credit losses was $4.4 billion, slightly up on a year-over-year basis. U.S. Bancorp’s non-performing assets (excluding covered assets) were $1.3 billion, down 23.5% year over year.
Strong Capital Position
During the quarter under review, U.S. Bancorp maintained a solid capital position. Effective Jan 1, 2014, the regulatory capital requirements for the company comply with Basel III, subject to certain transition provisions from Basel I over the next four years to full implementation by Jan 1, 2018.
The tier 1 capital ratio came in at 11.1%, in line with the prior-year quarter. Common equity tier 1 capital to risk-weighted assets ratio under the Basel III standardized approach fully implemented was 9.3% as of Jun 30, 2017, in line with the year-ago quarter.
All regulatory ratios of U.S. Bancorp continued to be in excess of “well-capitalized” requirements. In addition, based on the Basel III fully implemented advanced approach, the Tier 1 common equity to risk-weighted assets ratio was estimated at 11.7% as of Jun 30, 2017, compared with 12.0% as of Jun 30, 2016.
The tangible common equity to tangible assets ratio was 7.5% as of Jun 30, 2017, compared with 7.6% as of Jun 30, 2016.
U.S. Bancorp posted an improvement in book value per share, which increased to $25.55 as of Jun 30, 2017, from $24.37 recorded at the end of the year-earlier quarter.
Capital Deployment Update
Reflecting the company’s capital strength during the second quarter, U.S. Bancorp returned 81% of earnings to its shareholders through common stock dividends and buybacks. It surpassed the high end of the company’s long-term goal of returning 60–80% to its shareholders.
Conclusion
U.S. Bancorp posted an impressive quarter. Along with higher revenues, a solid capital position and increased lending activities were added advantages. The company follows a conservative growth stratagem and has made small but strategic acquisitions.
However, weakness in the credit card portfolio adversely affected its asset quality. Additionally, there are concerns related to the impact of legal issues and the company’s global exposure. Also, escalating expenses, along with provisions, remain headwinds.
U.S. Bancorp Price, Consensus and EPS Surprise
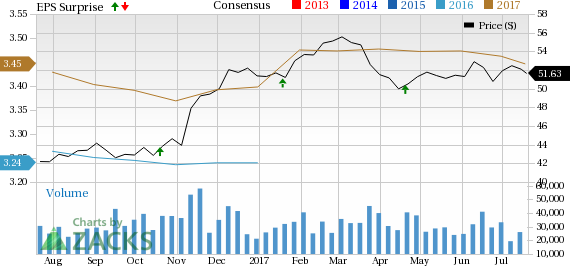
U.S. Bancorp Price, Consensus and EPS Surprise | U.S. Bancorp Quote
U.S. Bancorp currently carries a Zacks Rank #3 (Hold). You can see the complete list of today’s Zacks #1 Rank (Strong Buy) stocks here.
Performance of Other Major Banks
Higher interest income drove Wells Fargo & Company’s (NYSE:WFC) second-quarter 2017 earnings which recorded a positive surprise of about 4.9%. Earnings of $1.07 per share outpaced the Zacks Consensus Estimate of $1.02. Moreover, the figure compared favorably with the prior-year quarter’s earnings of $1.01 per share.
Citigroup Inc. (NYSE:C) delivered a positive earnings surprise of 5.0% in second-quarter 2017, riding on higher revenues. The company’s income from continuing operations per share of $1.27 for the quarter outpaced the Zacks Consensus Estimate of $1.21. Also, earnings compared favorably with the year-ago figure of $1.25 per share.
Rising interest rates and loan growth drove JPMorgan Chase & Co.’s (NYSE:JPM) ) second-quarter 2017 earnings of $1.82 per share, which easily surpassed the Zacks Consensus Estimate of $1.57. Also, the figure reflects a 17% rise from the year-ago period. Notably, the results included a legal benefit of $406 million.
Looking for Stocks with Skyrocketing Upside?
Zacks has just released a Special Report on the booming investment opportunities of legal marijuana.
Ignited by new referendums and legislation, this industry is expected to blast from an already robust $6.7 billion to $20.2 billion in 2021. Early investors stand to make a killing, but you have to be ready to act and know just where to look. See the pot trades we're targeting>>
J P Morgan Chase & Co (JPM): Free Stock Analysis Report
U.S. Bancorp (USB): Free Stock Analysis Report
Wells Fargo & Company (WFC): Free Stock Analysis Report
Citigroup Inc. (C): Free Stock Analysis Report
Original post
Zacks Investment Research