
A month has gone by since the last earnings report for Tyson Foods, Inc. (NYSE:TSN) . Shares have added about 2.1% in that time frame.
Will the recent positive trend continue leading up to its next earnings release, or is TSN due for a pullback? Before we dive into how investors and analysts have reacted as of late, let's take a quick look at its most recent earnings report in order to get a better handle on the important drivers.
Tyson Foods Q2 Earnings & Sales Miss Estimates, Rise Y/Y
Tyson Foods posted second-quarter fiscal 2018 results, with earnings and sales improving year over year. Performance in the quarter under review continued to benefit from steady growth in the Beef, Chicken and Prepared Foods segments. However, the top and the bottom line missed the Zacks Consensus Estimate.
Adjusted earnings for the period came in at $1.27 per share that missed the Zacks Consensus Estimate of $1.32. Adjusted earnings depicted a growth of 25.7% year over year. Performance during the quarter were driven by higher sales, cost savings of $65 million from Financial Fitness Program and 17 cents positive impact from lower tax rates.
Revenues and Margins
Net sales improved 7.6% to $9,773 million, courtesy of improved Beef, Chicken and Prepared Foods sales. Sales volume increased 1.9% during the quarter, while average sales price rose 5.6%. However, sales missed the Zacks Consensus Estimate of $9,944 million
Gross profit for the second quarter came in at $1,020 million, down 2.6% from the prior-year quarter’s tally. Gross margin also contracted 110 basis points (bps) to reach 10.4%.
Tyson Foods' adjusted operating income rose 11.4% to reach $694 million. Also, adjusted operating margin for the period came in at 7.1%, up 20 bps.
Segment Details
Chicken: Sales in the segment jumped 5.7% to $2,959 million. Sales volume improved 2% year over year owing to higher demand for chicken products and increased volumes resulting from the AdvancePierre buyout. Average sales price in the quarter increased 3.6%, courtesy of change in sales mix. Adjusted operating income rose 23.6% to $288 million and adjusted operating margin rose 140 bps to 9.7% during the quarter. Also, operating income growth in the segment was led by cost savings from Financial Fitness Program, gains from AdvancePierre buyout and lower feed expenses, partly negated by higher labor, growout and freight costs.
Beef: Sales in the segment jumped 5.5% to $3,681 million. Sales volume rose 1.8% year over year owing to robust domestic demand for beef products, improved availability of cattle supply and higher exports. Higher exports and beef demand outdid higher live cattle supply, leading to a 3.7% rise in average sales price. Adjusted operating income in the quarter was $120 million, down from the prior-year quarter’s figure of $126 million. Adjusted operating margin fell 30 bps to 3.3% during the quarter. Operating income growth in the segment was dismal during the quarter, thanks to greater labor and freight expenses.
Pork: Sales in the segment declined 2.8% to $1,265 million. The segment’s sales volume declined 1.1% year over year, owing to the company’s effort to balance supply with consumers’ demand. Average sales price also fell 1.8% due to lower livestock expenses. Adjusted operating income in the segment was $79 million, down 44% from the prior-year quarter’s tally. Adjusted operating margin contracted 460 bps to 6.2%. Escalated labor and freight expenses marred results.
Prepared Foods: Sales in the segment improved nearly 22.6% to $2,147 million. Prepared Foods’ sales volume grew 10.9% due to incremental volumes arising from the buyout of AdvancePierre. Average sales price rose 10.6% owing to favorable product mix from the acquisition of AdvancePierre and higher input costs. Adjusted operating income was $222 million in the quarter, surging 59.7% on a year-over-year basis. Adjusted operating margin expanded 240 bps to 10.3%. Operating income growth was fueled by Financial Fitness Program savings, better mix and gains from AdvancePierre. This was partly negated by greater freight and input costs as well as one-time cash bonus.
Other: Sales in the segment were $82 million, flat year over year. Sales volume dropped 7.1% and average selling price in the segment climbed 8.9%. The segment incurred adjusted operating loss of $15 million compared with the loss of $16 million in the year-ago quarter.
Other Financial Updates
Tyson Foods exited the quarter with cash and cash equivalent of $198 million, long-term debt of $8,872 million and shareholders’ equity of $12,156 million.
The company generated cash flow from operating activities of $1,139 million in the second quarter. Further, management projects capital expenditures at approximately $1.3 billion for fiscal 2018.
Guidance
Management is impressed with second-quarter fiscal 2018 results, which was backed by strength across its portfolio. The company expects demand for protein to rise consistently. Tyson Foods is well placed to exploit all opportunities in the space. For fiscal 2018, USDA expects overall domestic protein production (chicken, beef, pork and turkey) to rise roughly 3% year over year.
Further, the company estimates fiscal 2018 sales to increase nearly 6% in the range of $40-$41 billion. The upside can be attributed to higher revenues from AdvancePierre, increased volumes in its legacy business and enhanced mix in the Chicken segment.
Management continues to expect lower tax rates to boost the bottom line by 85 cents in fiscal 2018. The company envisions fiscal 2018 earnings in the range of $6.55-$6.70 per share, reflecting year-over-year growth of 23-26%.
During the fourth quarter of 2017, the company announced a Financial Fitness Program, which is expected to enhance operating efficiency in the forthcoming periods. In fiscal 2018, the program is expected to result in net savings of $200 million, buoyed by synergies from AdvancePierre’s integration along with incremental removal of non-value added costs.
How Have Estimates Been Moving Since Then?
In the past month, investors have witnessed a downward trend in fresh estimates. There have been two revisions lower for the current quarter. Last month, the consensus estimate has shifted downward by 6.6% due to these changes.
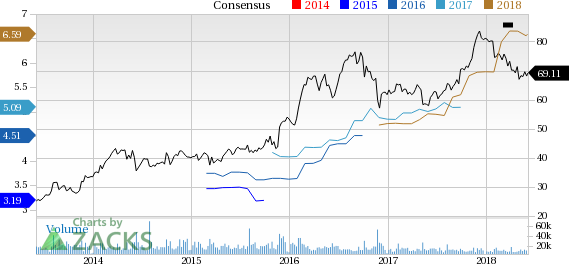
Tyson Foods, Inc. Price and Consensus
VGM Scores
At this time, TSN has an average Growth Score of C, though it is lagging a lot on the momentum front with an F. However, the stock was allocated a grade of A on the value side, putting it in the top quintile for this investment strategy.
Overall, the stock has an aggregate VGM Score of B. If you aren't focused on one strategy, this score is the one you should be interested in.
Our style scores indicate that the stock is more suitable for value investors than growth investors.
Outlook
Estimates have been broadly trending downward for the stock and the magnitude of these revisions indicates a downward shift. Interestingly, TSN has a Zacks Rank #3 (Hold). We expect an in-line return from the stock in the next few months.
Tyson Foods, Inc. (TSN): Free Stock Analysis Report
Original post
Zacks Investment Research