
Summary
The 3, 6, and 12-month moving average of monthly establishment job gains are all near 200,000, indicating the labor market is in good shape.
A drop in the West Census Region's new home sales market is the main reason for recent weakness in that part of the real estate market.
Low inventory and rising prices are probably the underlying reason for existing home sales moving sideways for the last few years.
The purpose of the Turning Points newsletter is to look at long-lead, leading, and coincidental economic data to determine if the economy is moving from expansion to contract; if we're at a "turning point."
This week's column will be a little different. I'm going to briefly look at the employment report (actually, I'll be looking at a single chart that has several key data points). Then I'm doing to look at the housing market. There have been several recent articles and blog posts that looked at the housing market data from several viewpoints (see here, here, here, and here). Some have been bearish, other not. After looking in detail at the data, I think the housing market is in fine shape.
As for the employment report, here's the key graph of the data:

(data from the St. Louis Fred system; author's calculations)
Above is a chart that shows the 3, 6, and 12-month moving average for the total monthly gain in establishment jobs. I prefer these to the monthly headline number because these calculations strip out the inherent noisiness of the monthly releases. All three average are near 200,000/month, which is more than adequate to say the labor market is in good shape.
Let's now turn to the housing market. Let's start with the observation that the macroeconomic backdrop is very strong: GDP growth hit a quarterly high in 2Q18; job growth remains strong -- we're probably below full employment; consumer sentiment is high. This is great news for housing, which can only expand when consumers are willing to take on what will be largest financial obligation of their lifetime: a mortgage.
Let's start by looking at the cost of mortgages:
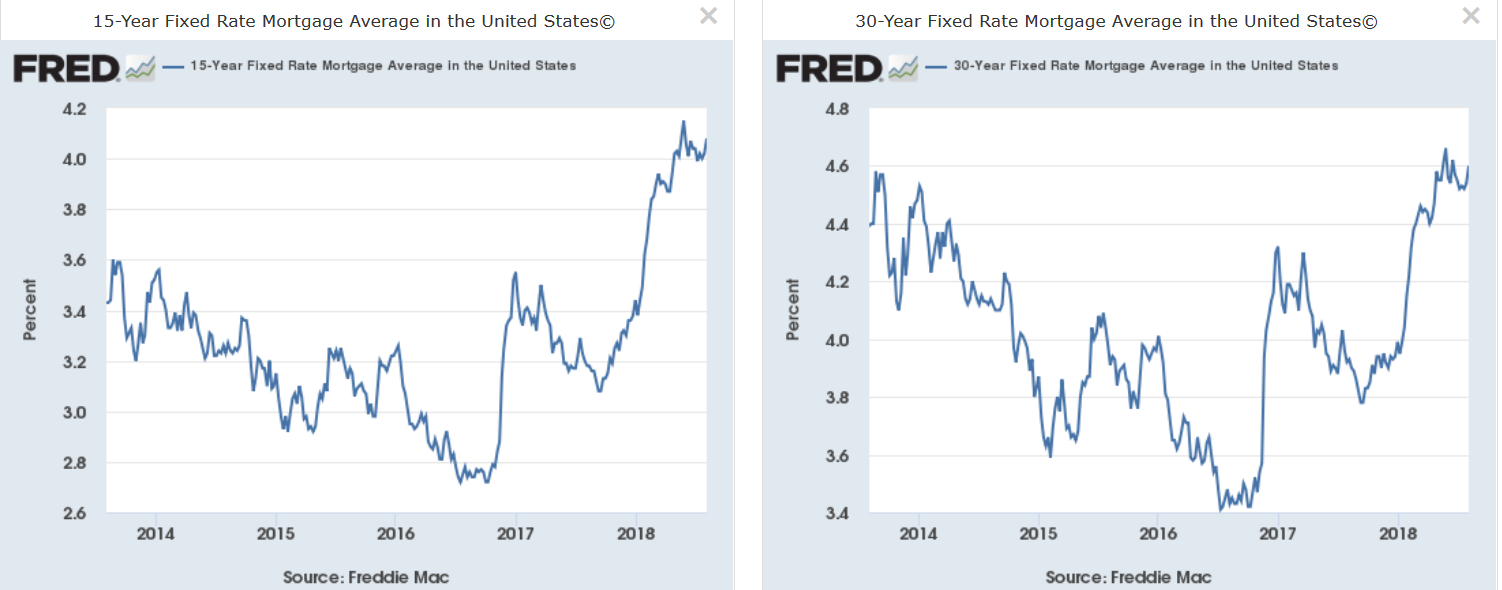
Yes, the 15 and 30-year mortgage are near 5-year highs. But slightly over 4% for a 15-year and 4.6% for a 30-year is hardly cost-prohibitive.
Next, let's look at the new home sales market:
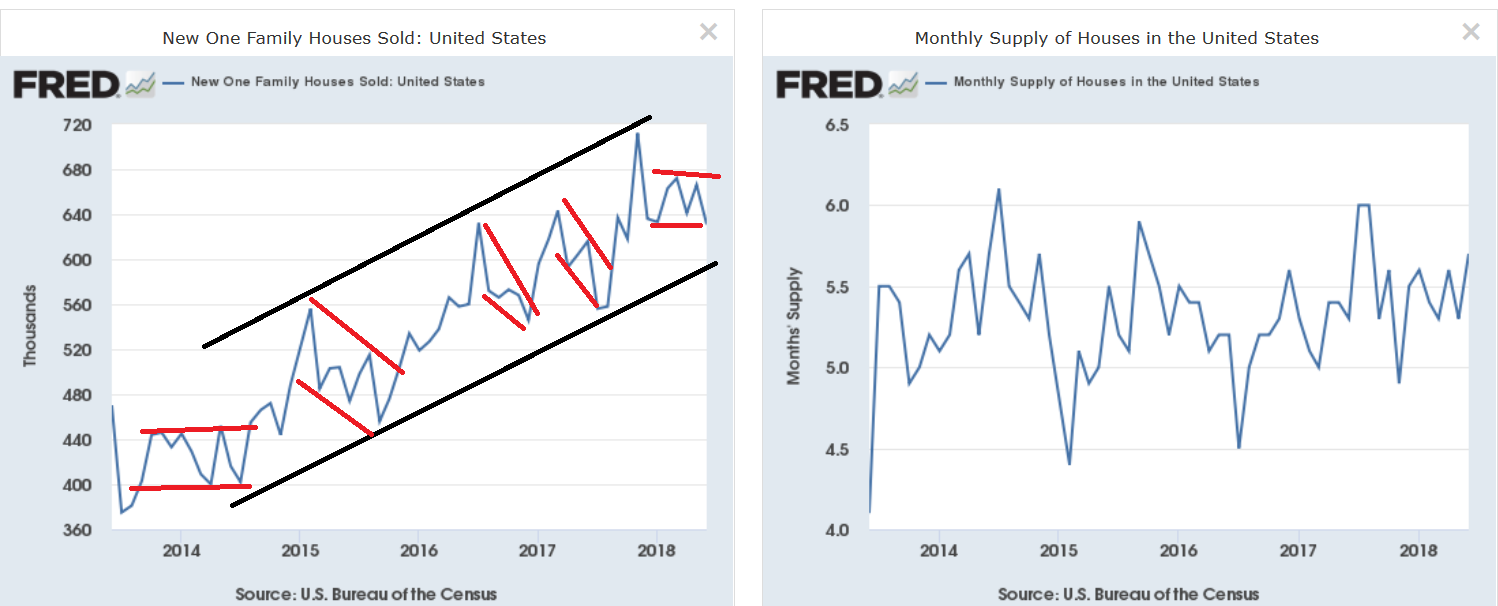
What seems to have caught several people's attention is the sideways shift in new home sales that started at the end of last year (left chart). This overlooks that we've seen several such sideways and downward trends in the data over the last five years (I've used red trend lines to highlight them). Despite these temporary moves, the overall trend remains up. There has not been a significant increase in the months of supply for new homes: demand has not contracted to a large enough degree to cause an inventory spike. In economic terms, this probably means that supply and demand are fairly evenly balanced.
When we break the data down by Census region, an interesting fact emerges:

Above is a 1-year chart of new home sales. I've converted the data to a base 100 rate using the end of the last recession as 100. Pay particular attention to the blue bar which represents the West Census region. That has dropped significantly, falling from over 200 in November 2017 to its current reading of 147 -- a decline of 26.5% All the other regions have held steady. The West accounts for 23% of all new homes sales (the South is by far the biggest region, comprising nearly 60% of new home sales). If the drop occurred across the U.S., then we'd have a problem. But not when the phenomena is localized.
We have seen a fairly sharp drop in new home prices:
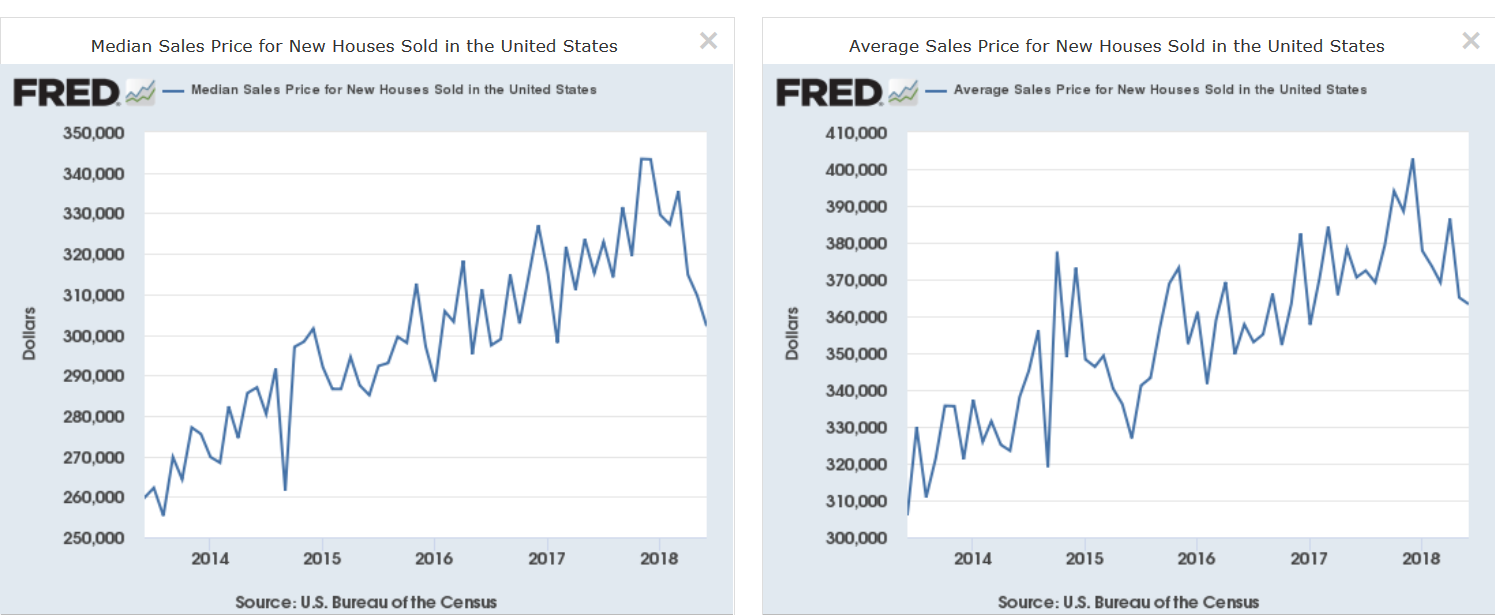
I'm not sure what is causing this. Some have argued it's due to a change in product mix; I think it's more a function of affordability. Regardless, this is something to keep an eye one. But it's not fatal, either.
Turning to the existing home sales market, we have the following two graphs:
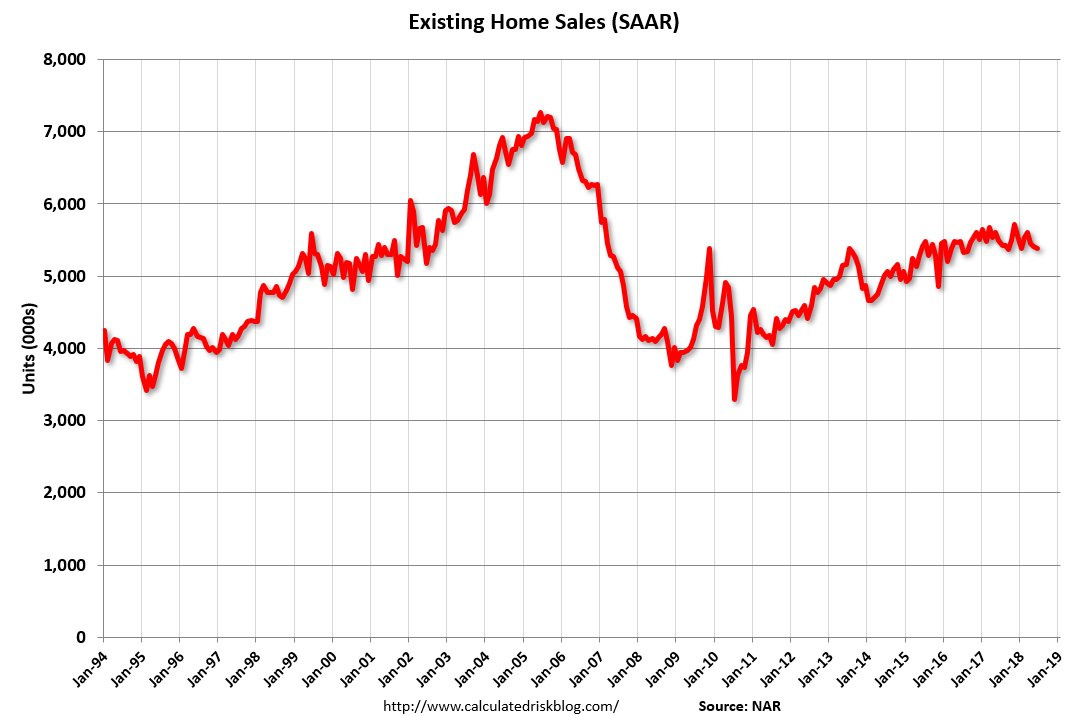
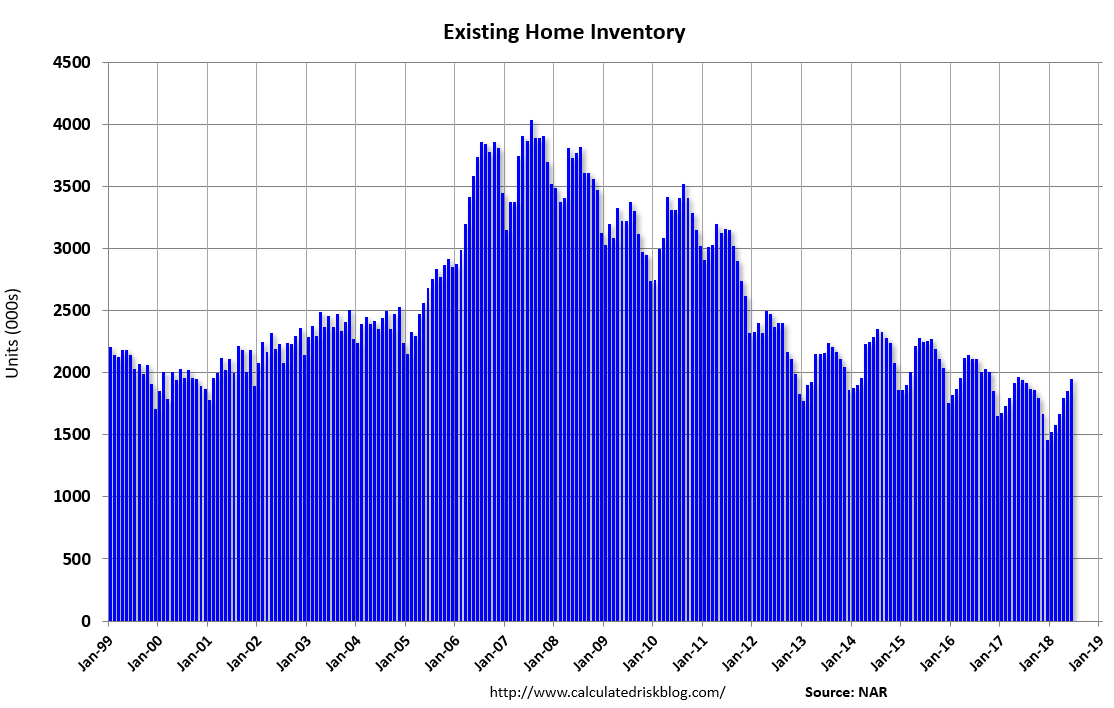
The above charts are from the blog Calculated Risk: if you're not reading it, you should.
Sales (top chart) have been moving sideways for about a year-and-a-half. This is probably a function of low inventory (top chart) and price:
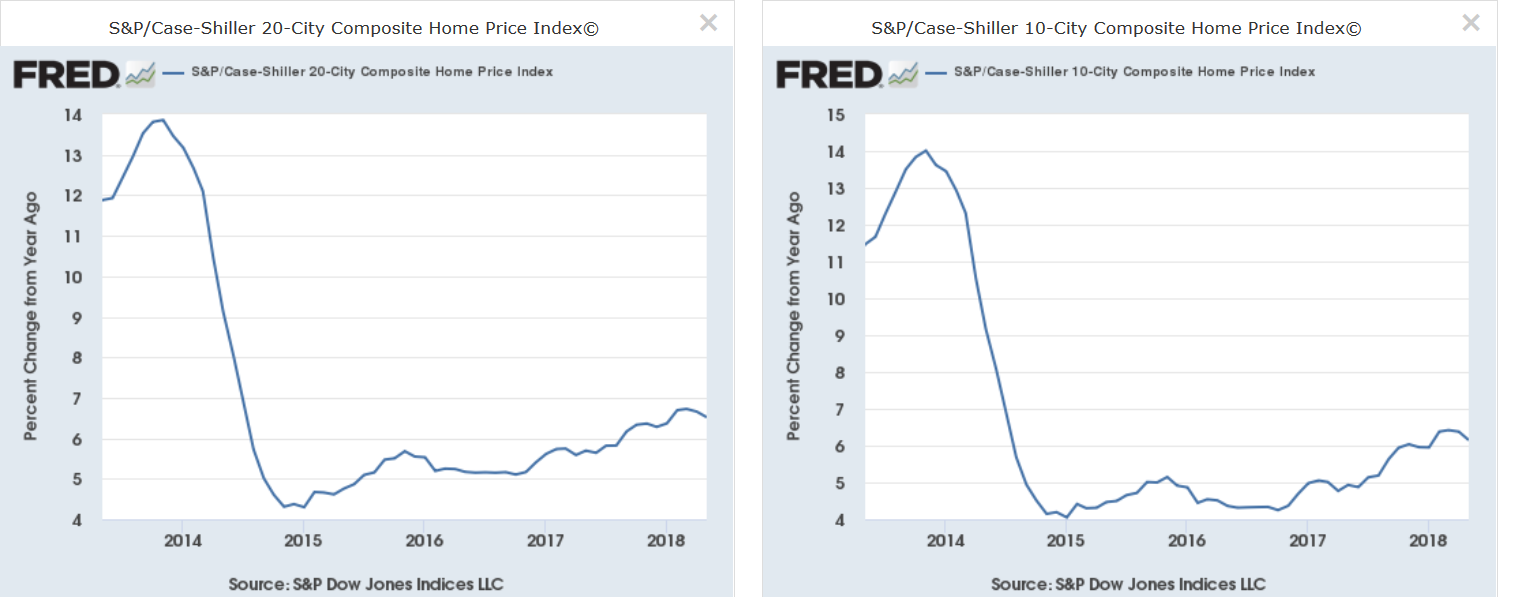
The Case-Shiller 10 and 20-City price index are both showing solid increases, which is probably starting to push people out of the market.
To conclude, calls for a peak in the housing market appear premature. The economic backdrop is still very favorable. Mortgage rates are still low. New home sales have been weak solely due to a drop in sales in the West Census region. Existing home sales are moving sideways, probably due to low inventory and rising prices. Therefore, I think the argument that the housing market has peaked is premature. Put in the language of this newsletter, the housing market isn't at a turning point.
Disclosure: I/we have no positions in any stocks mentioned, and no plans to initiate any positions within the next 72 hours.
I wrote this article myself, and it expresses my own opinions. I am not receiving compensation for it (other than from Seeking Alpha). I have no business relationship with any company whose stock is mentioned in this article.