
 Summary
- So far, earnings reports have been positive. But business sentiment indicators are weaker.
- The yield curve continues to behave in a standard, end-of-cycle manner. The shutdown's negative impact is probably reading a non-linear point.
- My recession probability in the next 12-18 months is still 25%.
The purpose of Turning Points is to analyze the long-leading, leading, and coincidental economic indicators to determine if the economic trajectory has changed from expansion to contraction - to see if the economy has reached a "Turning Point."
Currently, I have a 25% recession probability in the next 12-18 months, which is based on the following leading indicators: weaker building permits, a flattening yield curve, and heightened corporate spreads.
Long-Leading Indicators
As we are in the middle of earnings season, let's check in with Zacks (emphasis added):
Total earnings for the 77 S&P 500 members that have reported Q4 results already are up +14.2% from the same period last year on +8.1% higher revenues, with 70.1% beating EPS estimates and 62.3% beating revenue estimates...
Looking at Q4 as a whole, combining the actual results that have come out with estimates for the still-to-come companies, total earnings for the S&P 500 index are expected to be up +11% from the same period last year on +5.5% higher revenues.
This only covers publicly traded companies, so it will differ from the BEA industry data. But the overall trend is positive. However, this is occurring during a period of heightened political, financial, and economic uncertainty. Consider the following excerpt from the latest Beige Book (emphasis added):
Outlooks generally remained positive, but many Districts reported that contacts had become less optimistic in response to increased financial market volatility, rising short-term interest rates, falling energy prices, and elevated trade and political uncertainty.
The hard data is positive; rising corporate earnings are the result of increasing demand. Increasing revenue also provides fuel for additional capital spending on hiring (The Bank of Japan calls this the "virtuous cycle"). But the sentiment data blunts the potentially positive ramifications of rising earnings. While it's impossible to quantify the overall impact, it is certainly there.
Leading Indicators
Let's start with the good news: the four-week moving average of initial unemployment claims looks great:

The continued low level of this moving average indicates that the labor market is in good shape.
Now, let's turn to the yield curve, which is decidedly bearish:

The total curve slope (the difference between the 30-year and 3-month Treasury securities) has declined to as low as 52 basis points earlier this year. It has since risen 9 BP to 63 BP. Regardless of the modest sell-off in the long-end, the continued flattening of the yield curve is a standard, end-of-the-economic-cycle development.
The 10-year-3-month spread is also tightening: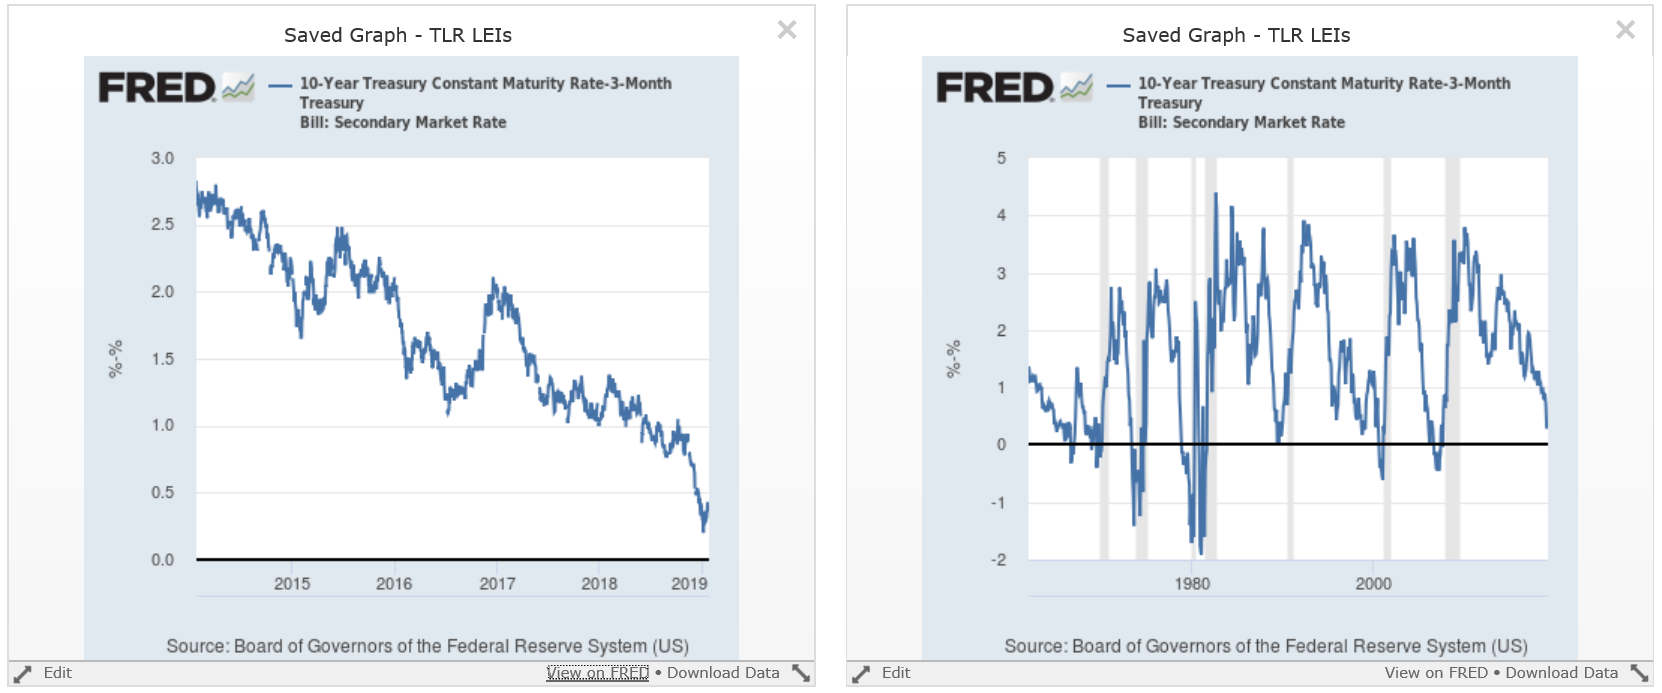
The left chart shows the last five years for the 10-3 spreads, while the right chart shows the last sixty years of data. Recently, the spread has been as low as 29 basis points; it has since widened out to 43, but it is still very narrow.
The belly of the curve is also tightening:

The spread between the 5-year and 3-month Treasury (in red) and 7-year and 3-month Treasury (in blue) is also narrowing.

And the spread between the 5-year CMT-1-year-CMT (in blue) and 7-year CMT-1-year-CMT (in red) has already inverted modestly since the first of the year.
Finally, let's take a look at orders for two classifications of durable goods:

The absolute level of orders for consumer durable goods (top left chart) continues to rise. The Y/Y pace (right chart) is still strong. Orders for industrial capital goods (lower left charts) started to rise in 4Q16, increased for about two years, and have plateaued at high levels for the second half of 2018. While the Y/Y has declined (right chart), it's still at a solid level.
However, let's add the latest ISM manufacturing data to the analytical mix. In the latest ISM report, the overall PMI decreased 5.2 and the new orders index declined a far sharper 11 points (from 62.1-52.1). And the anecdotal comments were decidedly more bearish (emphasis added):
- "Growth appears to have stopped. Resources still focused on re-sourcing for U.S. tariff mitigation out of China." (Computer & Electronic Products)
- "Brexit has become a problem due to labeling changes." (Chemical Products)
- "Customer demand continues to decrease [due to] concerns about the economy and tariffs." (Transportation Equipment)
- "Starting to see more and more inflationary increases for raw materials. Also, suppliers [are] forcing price increases due to tariffs." (Food, Beverage & Tobacco Products)
- "The ongoing open issues with tariffs between U.S. and China are causing longer-term concerns about costs and sourcing strategies for our manufacturing operations. We were anticipating more clarity [regarding] tariffs at the end of 2018." (Machinery)
- "Business is steady, but the pace of incoming orders is slowing." (Furniture & Related Products)
- "Business is robust for certain sectors [aerospace] and flat to downward for others [energy]. Tariffs continue to impact business direction and profit." (Miscellaneous Manufacturing)
- "Caution seems to be the outlook. Are we in a correction, or is the market getting ready to slow over time?" (Fabricated Metal Products)
- "No major change in business operations towards the end of 2018; however, we are carefully monitoring oil prices and outside influence from market conditions to better understand our 2019 outlook and capital plans." (Petroleum & Coal Products)
- "Customers are hedge buying in December as a result of announced price increases starting in January." (Textile Mills)
This is only the second report with weakening sentiment indicators. Should there be a break-through in U.S.-China negotiations and a conclusive resolution to Brexit, sentiment could reverse. However, if stresses continue, expect negative hits to activity.
Finally, we have to consider the shutdown's potential impact on the economy. The White House's Chief Economic Advisor says this could slow growth to 0%. I don't think we're quite there yet. However, I do think the following analysis is accurate (emphasis added):
"The economic impact of the shutdown is modest," Ryan Sweet, director of real-time economics for Moody's Analytics, tells me. "But we're now getting into the period where the spillover effects are becoming more intense." Lewis Alexander, the chief U.S. economist for Nomura, agrees the shutdown is now "at a point where these effects could become nonlinear."
We ultimately won't know the impact until 1Q numbers have been reported and revised. But I have yet to see anyone say the shutdown will be a plus.
Conclusion: The flattening yield curve, weaker business sentiment, and increased uncertainty caused by the shutdown lead me to conclude there is a 25% probability of a recession in the next 12-18 months.
Disclosure: I/we have no positions in any stocks mentioned, and no plans to initiate any positions within the next 72 hours. I wrote this article myself, and it expresses my own opinions. I am not receiving compensation for it (other than from Seeking Alpha). I have no business relationship with any company whose stock is mentioned in this article.