Turning Points For The Week Of February 11-15
Summary
- Analysts are now predicting a corporate earnings recession within the next 2-4 quarters.
- The four-week moving average of continuing unemployment claims may have bottomed for this cycle; retail sales dropped sharply.
- I maintain a 25% recession probability in the next 6-12 months.
The purpose of the Turning Points Newsletter is to analyze the long-leading, leading, and coincidental indicators to determine if the U.S. economic trajectory has changed from expansion to contraction - to see if the economy has reached a "Turning Point."
Current Conclusion: There is a 25% probability of a recession in the next 6-12 months. Although lower-rated corporate credits yields have eased in the last few weeks, the growing possibility of a corporate earnings recession, the potential bottoming in the four-week moving average of initial unemployment claims, and the weak retail sales numbers all contribute to the possibility.
Long-Leading Indicators
There is a growing possibility that we'll see an earnings recession in the next 3-4 quarters. From the NY Times (emphasis added):
Halfway through the first quarter of the year, analysts now expect profits of companies in the S&P 500 to decline by 1.7 percent from the same period last year, according to data from John Butters, senior earnings analyst at FactSet.
That is a sharp reversal from the start of 2019, when the same analysts predicted that corporate earnings would rise by 3.3 percent compared with the first quarter of 2018. And in October, before the stock markets entered a downward spiral at the end of the year, analysts had anticipated that first-quarter earnings would leap by 6.6 percent.
Corporate profits lead the economy by 6-12 months. Rising demand causes profits to increase, which in turn support higher corporate spending. There is also rising uncertainty among corporate decision makers, as observed by Philadelphia Fed President Harker (emphasis added):
Businesses, on the other hand, have reported an increase in uncertainty and a decrease in confidence. Coupled with tighter financial conditions, the investment outlook is not quite as rosy as last year. It's certainly not a dire one, but the specter of uncertainty does cast a shadow, and the ambiguity of the current climate appears to be having a dampening effect.
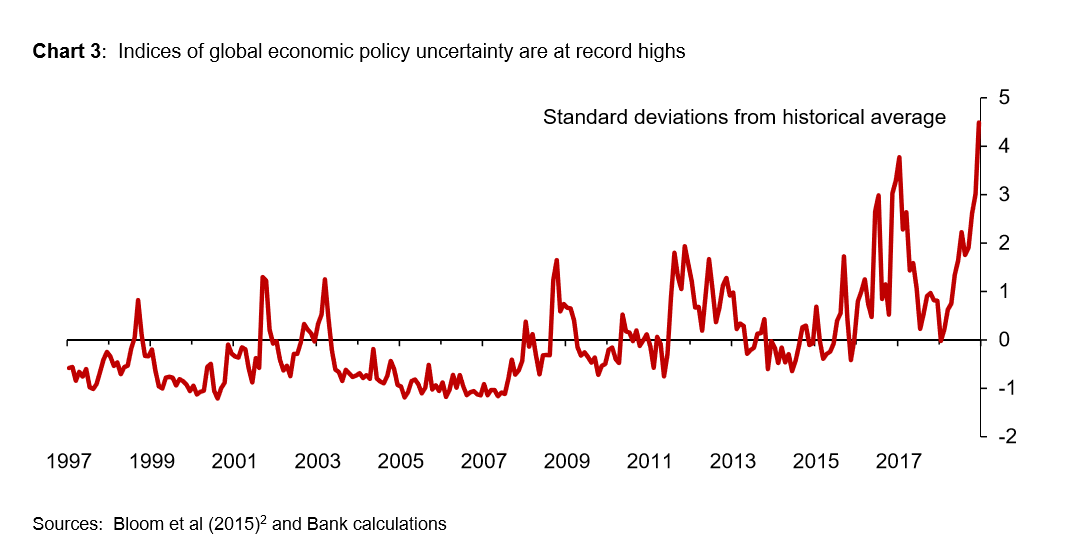
Bank of England Head Carney made the same observation in a speech this week, noting that uncertainty is now at its highest level in over 20 years as shown in this chart:
Long-leading indicators conclusion: Lower corporate profits and rising uncertainty are a net negative.
Leading Indicators
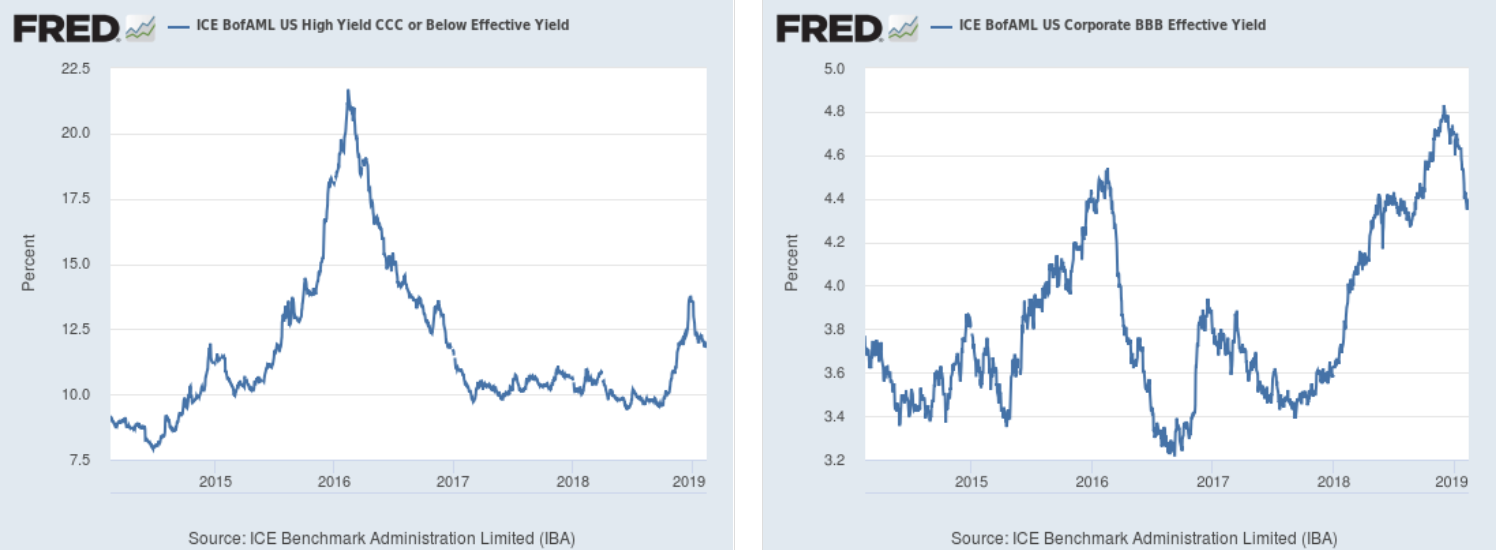
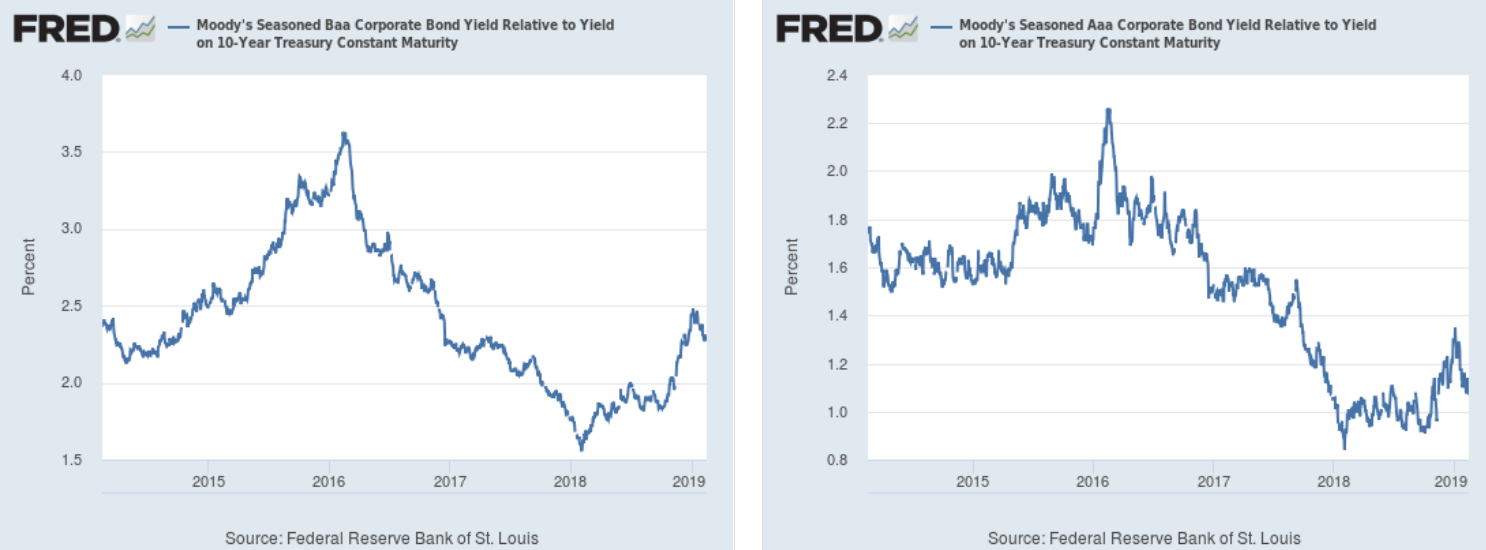
The good news is that tensions in the corporate funding market have eased.
CCC (left) and BBB (right) yields have dropped. CCC levels are still high but are not at prohibitive levels. BBB levels have lowered to mid-2018 levels.
And the Baa/10-year spread (left) has come in, as has the Aaa/10-year spread (right).
Unfortunately, new questions are emerging about the labor market.
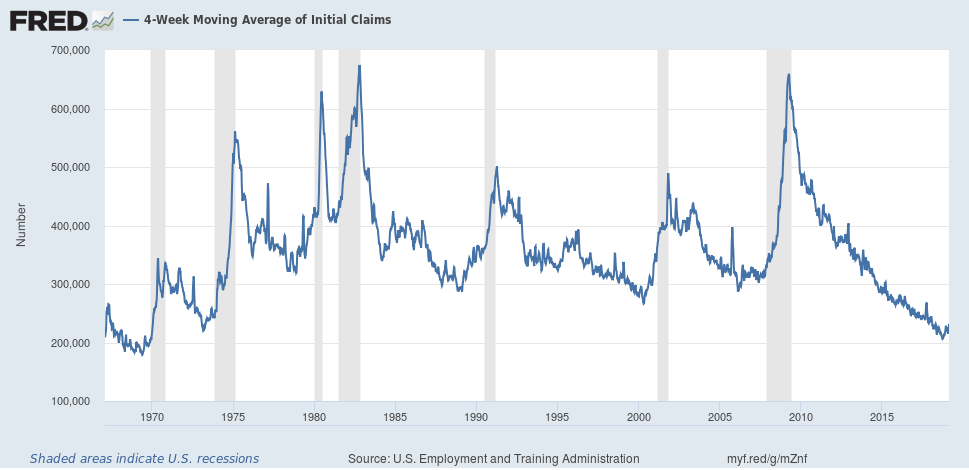
The four-week moving average of initial jobless claims turns noticeably higher 6-12 months before a recession. The current level hasn't been seen since the mid-1970s. On one hand, this is very positive, indicating that the jobs market is in incredibly good shape. But it also means that it can't go any lower; it has nowhere to go but up.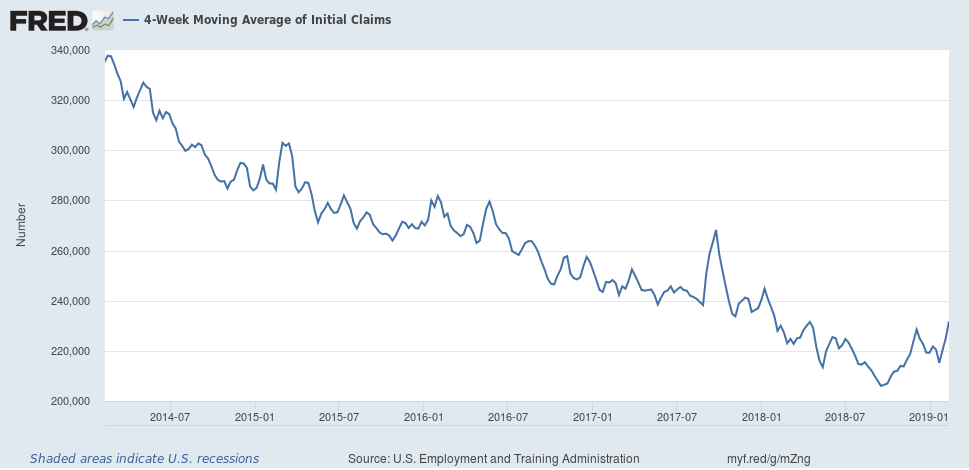
The series printed a low of 206,000 on September 15. Since then, it has risen consistently. This is not inherently fatal; it's possible the series could move lower. But it has now moved higher for four months, which means a small upward trend is in place. The longer the data moves higher, the more likely it has bottomed. This series is now flashing yellow.
Additionally, the yield curve is still behaving in an end-of-cycle manner.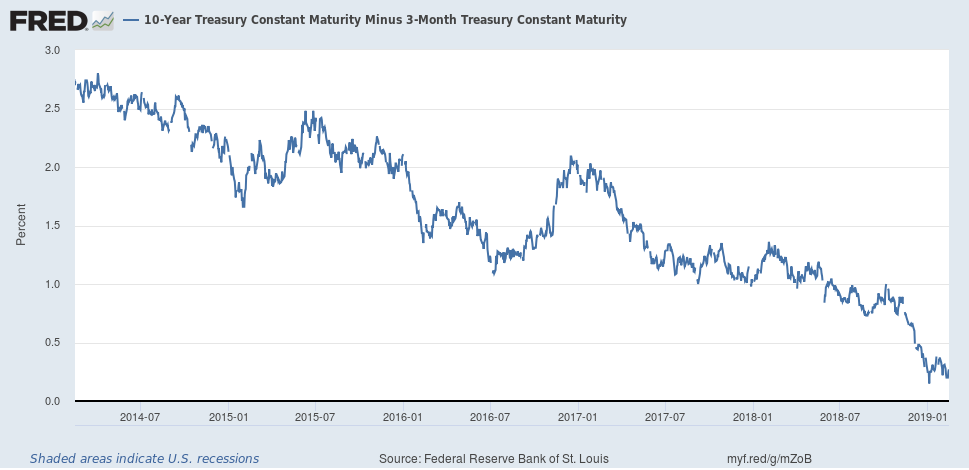
The 10-year-3-month spread is still below 50 basis points, as is ... 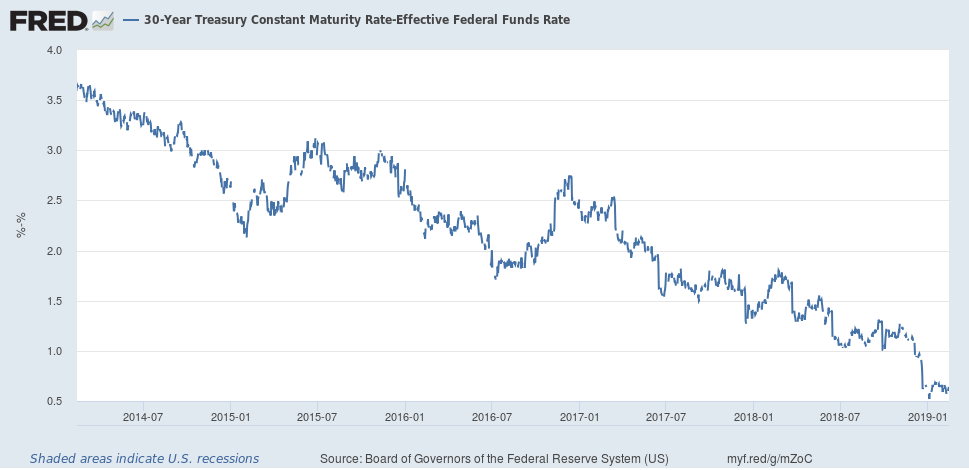
... the 30-year Fed funds spread.
And the spread between the longer and shorter ends of the belly of the curve is, at best, below 40 basis points.
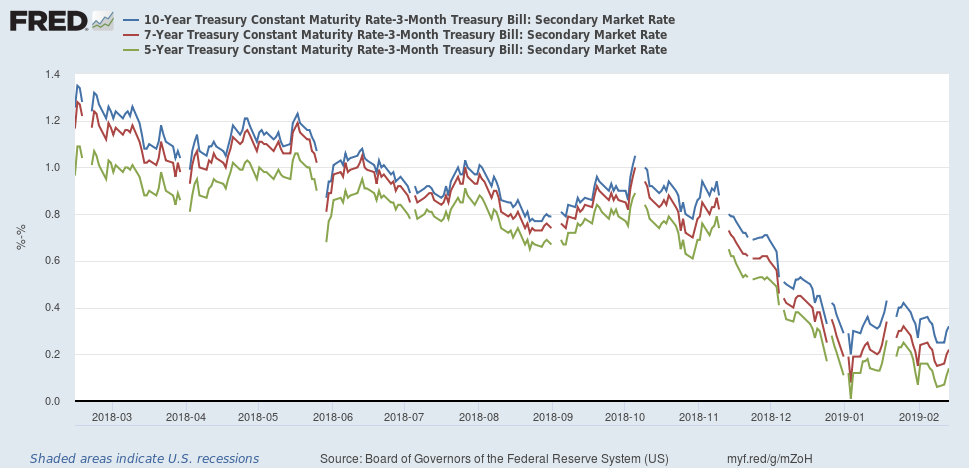
Finally, parts of the belly of the curve are already inverting:
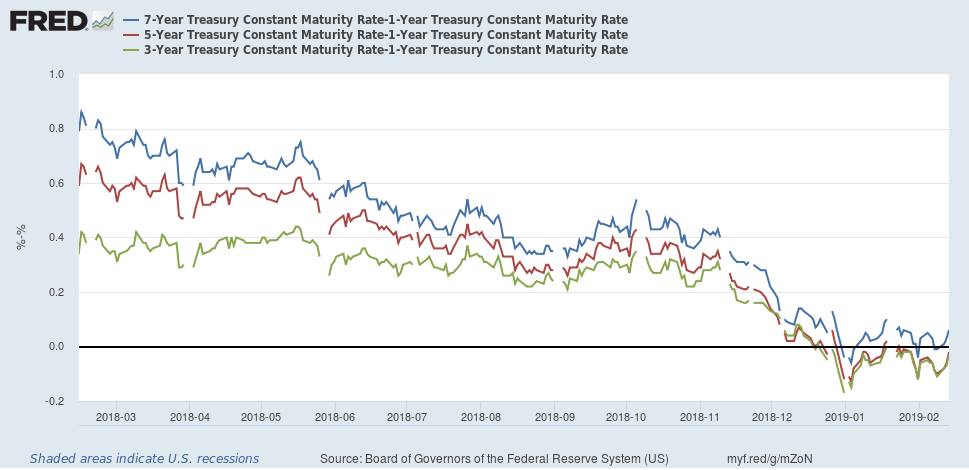 The 5-1 spread (in red) and 3-1 spread (in green) have been negative since the first of the year.
The leading indicators are flashing yellow: the yield curve continues to behave in a standard end-of-the-economic-cycle manner, while there's a growing possibility that the four-week moving average of unemployment claims has bottomed for this cycle.
Coincidental Indicators
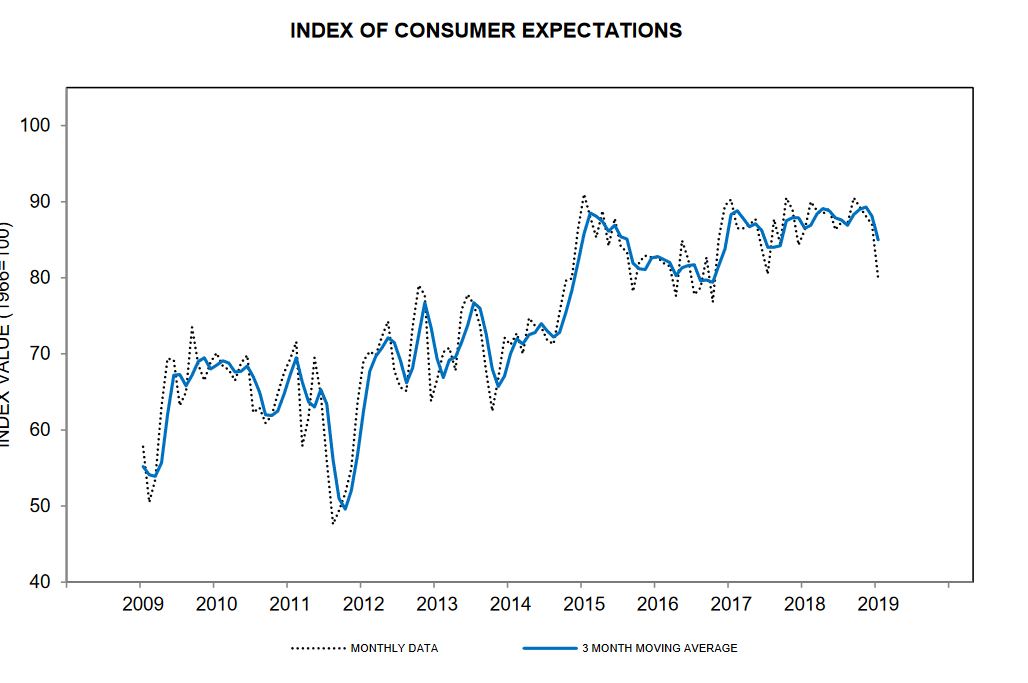
Before looking at the Census data from this week's retail sales report, let's look at the fundamental background. Unemployment is low. In fact, the last few employment reports have been surprisingly strong. Wages are rising. At the same time, financial news was terrible in December. The stock market swooned while the headlines were filled with news of the potential and then the actual government shutdown. This explains why consumer future expectations dropped sharply in the latest University of Michigan survey:
This explains - at least partially - why the retail sales declined 1.2% M/M (-1.9% ex-auto sales). A drop in oil prices is at least partially responsible. Gas sales (which represent 8% of total retail sales) were 5.1% lower. Auto sales (21% of the total) were also a surprising bright spot; they increased by 1%.
But that's where the positive spin stops. Furniture sales were off 1.3%; health/personal care sales declined 2%, and internet sales fell 3.9%. The latter is especially concerning as this was for December, the height of the consumer shopping season. Ultimately, we're left with a report that was shockingly bad. The only good news is that the bearish macroeconomic environment temporarily depressed consumer spending, making the next few months' data that much more important.
Coincidental numbers conclusion: One month of bad data does not warrant shifting to a negative outlook, especially when the reason for the decline can be easily explained as situational. However, it's not a healthy development, either. If you conceive the economic indicators as a set of dominos, the long-leading falls first, followed by the leading, then the coincidental. It's possible we've simply seen the first domino fall.
Disclosure: I/we have no positions in any stocks mentioned, and no plans to initiate any positions within the next 72 hours. I wrote this article myself, and it expresses my own opinions. I am not receiving compensation for it (other than from Seeking Alpha). I have no business relationship with any company whose stock is mentioned in this article.

