
Forex News and Events
TRY: The debasement continues
The Turkish lira sank to fresh lows against the dollar this morning with USD/TRY hitting 3.7778, up 1.25% on the session. The lira has had a tough start into the new year, sliding more than 6% against the greenback since January 1st, making it the worst performer in the FX market. The quick lira depreciation, coupled with rising inflationary pressures (+8.53%y/y last December versus 7% in November) has substantially increased the pressure on the central bank, which is now almost obliged to increase interest rates to try to curb inflation. Indeed, the acceleration of the lira’s depreciation since the beginning of the year is mostly due to the CBT’s silence. The market is now wondering whether the CBT is still independent or under the government’s thumb. This may be just the beginning should the central bank back off from its initial mandate, which is to control price pressure, and not to be the government’s puppet.
BRL: BCB to cut rates
The Brazilian central bank will cut its benchmark interest rate by 50bps as soon as tomorrow, thanks to easing inflationary pressure. Unlike Turkey, where the central bank has been deviating from its mandate, the BCB hung on and lifted the Selic rate as high as 14% last year to curb rising price pressure. Its efforts have paid off as the main inflation gauge - the IPCA - has been heading lower since January last year when it hit 10.71%y/y. Last November, the gauge fell to 6.99%y/y, the lowest level since December 2014. The BCB should continue to gradually relieve pressure on the economy, which should give rise to growth. On the currency side, the Brazilian real started the year on a firm footing, rising 1.56% since January 1st, after appreciating more than 4% in December. We expect the real to sustain its momentum with USD/BRL heading for the 3.0 threshold as a first step.
China’s foreign exchange reserves strongly decline
Last weekend, China disclosed its foreign reserves as of December showing a sharp $41 billion decline to $3010 billion from $3051 billion. China has stated that this decrease is a side effect of their efforts to stabilise the renminbi and to save the currency from further decline.
In our view, this seems rather contradictory. We believe that China is trying to devalue its currency to favour its exports. We also firmly believe that Mainland China wishes to get rid of the dollar as policymakers are likely concerned about the inflationary risks attached to it due to the Fed's ultra-loose monetary policies over the last decade.
The decline of China's FX reserves also means that the commercial surplus (export minus imports) is declining, which will have an impact on growth. Moreover, China's shift towards a more domestic-driven economy may also justify the strong decline.
Finally, China is investing heavily in Europe and Africa where lands, forests, industries are being bought as an alternative to hoarding the dollar. As a result, we do not see any reason why USD/CNY would not head towards 7 in the medium-term.
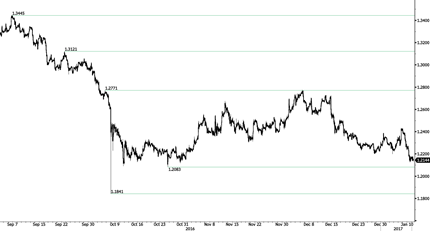
GBP/USD - Targeting Support At 1.2083.
The Risk Today
Yann Quelenn
EUR/USD failure to test 1.0653 resistance has led to a mild correction towards 1.0506 support. Next hourly support lies at 1.0341 (03/01/2017 low). Hourly resistance is given at 1.0653 (30/12/206 reaction high) then 1.0670 (14/12/2016 high). Expected to see continued sideways price action in the short-term. In the longer term, the death cross late October indicated a further bearish bias. The pair has broken key support given at 1.0458 (16/03/2015 low). Key resistance holds at 1.1714 (24/08/2015 high). Expected to head towards parity.
GBP/USD has reversed after false break out of recent bearish channel. Hourly support lies at 1.2083 (25/10/2016 low) while hourly resistance lies at 1.2268 (intraday high). The technical structure suggests further downside. The long-term technical pattern is even more negative since the Brexit vote has paved the way for further decline. Long-term support given at 1.0520 (01/03/85) represents a decent target. Long-term resistance is given at 1.5018 (24/06/2015) and would indicate a long-term reversal in the negative trend. Yet, it is very unlikely at the moment.
USD/JPY is bouncing on former resistance given at 114.83 settling in current 2-month 116.12 to 118.66 range. Hourly support lies at 114.74 (12/12/2016 low). Expected to see further range trading. We favor a long-term bearish bias. Support is now given at 96.57 (10/08/2013 low). A gradual rise towards the major resistance at 135.15 (01/02/2002 high) seems absolutely unlikely. Expected to decline further support at 93.79 (13/06/2013 low).
USD/CHF is moving sideways between hourly resistance is given at 1.0344 (15/12/2016 high) and support at 1.0021 (08/12/2016 low). Key support is given at the parity. Expected to further consolidate around 1.0200. In the long-term, the pair is still trading in range since 2011 despite some turmoil when the SNB unpegged the CHF. Key support can be found 0.8986 (30/01/2015 low). The technical structure favours nonetheless a long term bullish bias since the unpeg in January 2015.
