The S&P 500’s ‘Trump Trade’ is still intact per a chart guy actually worth listening to, Rich Ross, who I met 7 years ago when he worked at the firm (Auerbach-Grayson) run by my late friend, Jonathan Auerbach. Nice guy with nice, clear charts and no need to over complicate things.
Here he shows SPDR S&P 500 (NYSE:SPY) above its SMA 50, which folks, is one of the reasons why I covered my own short positions. The other reasons were that the SOX was still on its short-term moving averages and Goldman and the Financials were smashing into lateral support and getting oversold.
This one chart shows why ‘the Trump trade’ is still intact (video link)
Okay, so it’s an MSM (CNBC) soft-serve trying to bait clickers, but it’s a guy actually telling us how simple TA is. I mean, take a look at Stocktwits (← that’s a link to follow me) or TradingView and see how complicated people can make their charts. There are so many tools available that I think you can actually make any chart say pretty much what you want it to say. To the uninitiated, that can be dangerous (pay no attention to that overly technical sounding man behind the curtain!) stuff.
So Ross’s simple MA 50 is as good as any other tool, and IMO better than a lot of the overly involved tools that make your jaw drop in awe and your head spin in confusion (hello Elliott Wave, hello Dow Theory, hello Fibonacci Time Zones, etc.).
Very clearly, the stock market is technically intact. My personal view is that there is a decent chance it will become un-intact to the extent that a stronger correction ensues, perhaps after a bounce. That would paint NFTRH’s long-held view of SPX 2410 “by March/April” (prior to correction) as a really good call. But the market is intact as of now so nothing is settled. What’s more, it would be intact at the lateral support zone he notes as well.
This post is from a TA who readily admits to you that TA is a bunch of hocus pocus if not used as a probabilities tool with all due humility and simplicity. My two favorite indicators are, not coincidentally, moving averages and lateral support/resistance. Good job Rich. MSM needs more understatement and less sensationalizing.
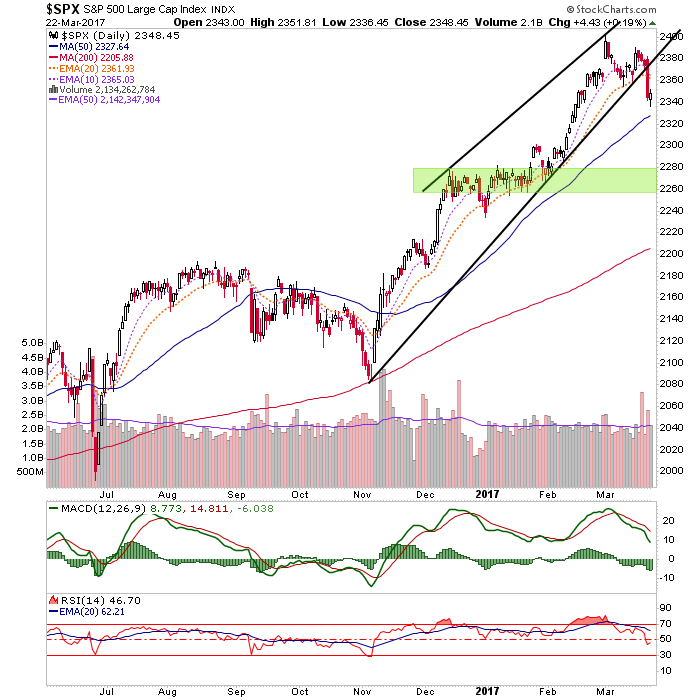
Here is my own version of the S&P 500’s chart, with the SMA 50 just below, but also a view of a broken trend line (all trend lines break eventually and so, they are not among my favorite tools). So let’s get a little more detailed; how about SPX tries to bounce to the short-term moving averages (EMA 10 and 20, dotted lines), fails and then really gets a correction going?
If this would be just a routine correction, the noted lateral support shelf would be a good target. Personally, I am leaning toward the correction not nearly being over and will be sensitive to reestablishing short positions against longs held in strategic areas.

