This article has already been saved in your Saved Items
EUR/USD
-0.10%
Add to/Remove from Watchlist
Add to Watchlist
Add Position
Position added successfully to:
NZD/USD
-0.20%
Add to/Remove from Watchlist
Add to Watchlist
Add Position
Position added successfully to:
CAD/JPY
+0.02%
Add to/Remove from Watchlist
Add to Watchlist
Add Position
Position added successfully to:
JP225
+0.04%
Add to/Remove from Watchlist
Add to Watchlist
Add Position
Position added successfully to:
HK50
+0.48%
Add to/Remove from Watchlist
Add to Watchlist
Add Position
Position added successfully to:
SSEC
+0.27%
Add to/Remove from Watchlist
Add to Watchlist
Add Position
Position added successfully to:
Investors’ morale remained supported during the European session, but softened late during the US one, with Asian bourses following suit. It seems that market participants may have decided to lock some profits ahead of US President Trump’s conference on China. With regards to the data releases, the most important ones may be Eurozone’s preliminary inflation data for May and Canada’s GDP for Q1, which could add to the case of more stimulus by the ECB and the BoC.
INVESTORS TURN CAUTIOUS AHEAD OF TRUMP’S CONFERENCEThe US dollar traded lower against all the other G10 currencies on Thursday and during the Asian morning Friday. It lost the most ground against NOK, SEK, AUD, and EUR in that order, while it underperformed the least versus CAD, JPY and NZD.
US Against Majors Daily Performance
The weakening of the dollar, combined with the fact that the yen was among the main losers, suggests that risk appetite remained supported for another day. However, the risk-linked Kiwi was also among the currencies that gained the least versus the greenback, which points otherwise. Thus, in order to clear things up with regards to the broader market sentiment, we prefer to turn our gaze to the equity world. There, major EU indices continued climbing north, perhaps staying supported by the EU Commission’s proposal with regards to a EUR 750bn fund to support the Union’s economies battered by the coronavirus crisis. That said, risk appetite softened during the US session, with all three of Wall Street’s main indices ending their session in the red. The subdued morale rolled over into the Asian session today as well, with Japan’s Nikkei and Hong Kong’s Hang Seng sliding 0.29% and 0.54% respectively. At the time of writing, China’s Shanghai Composite is up only 0.15%.
Major Stock Indices
It seems that investors decided to adopt a more cautious approach, locking some profits, as US President Trump said he will hold a news conference on China today. Yesterday, the world’s second largest economy proceeded with the passing of the national security legislation on Hong Kong, and it remains to be seen what the US’s response will be. If Trump decides to proceed with mild action, like travel and/or financial sanctions on Chinese officials, we don’t expect equities to tumble much. Actually, we would expect them to rebound at some point soon, perhaps next week, as investors may turn their attention back to the easing of the lockdown measures and the possibility of the global economy restarting its engines. Now, in case the US’s response is a bolder one, like scrapping the “Phase One” trade deal and/or imposing fresh tariffs, the slide in risk assets could be larger, bringing into question further recovery in the broader sentiment. EUROZONE CPIS AND CANADA’S GDP ON TODAY’S AGENDABack to the currencies, the euro continued marching higher against its US counterpart, staying supported by the EU Commission’s plans, and also taking advantage of the dollar’s tumble. As for today though, EUR-traders may pay some attention to Eurozone’s preliminary inflation data for May. The headline rate is forecast to have slid to +0.1% YoY from +0.3%, while no forecast is available for the core one. The HICP excluding energy and food YoY rate is anticipated to have stayed unchanged at +1.1%. Bearing in mind that both Germany’s CPI and HICP rates slid notably yesterday, we would see the risks, at least surrounding the headline rate, as tilted to the downside.
German vs. Eurozone CPIs YoY
When they last met, ECB policymakers eased the conditions of their TLTROs and introduced a new series of non-targeted pandemic emergency long-term refinancing operations (PELTROs), staying ready to adjust all of their instruments, as appropriate, to ensure that inflation moves towards their aim in a sustained manner. Last Thursday, the preliminary PMIs for the month rebounded by more than anticipated, but stayed well below the boom-or-bust zone of 50, keeping the door for further stimulus wide open. Thus, with that in mind, we believe that further slowdown in Eurozone’s inflation, or perhaps a deflationary print, may increase the chances for the ECB to adopt additional easing measures, and/or to expand the existing ones, perhaps as early as at next week’s gathering. Something like that could prove negative for the euro, but the broader direction in EUR/USD may depend on Trump’s response to China. If it’s a soft one, any slide due to Eurozone’s inflation data may be treated as a corrective setback before the next leg higher. In order to start examining a negative reversal, we would like to see a switch to risk-off, something that could benefit the safe-haven dollar. This could happen if Trump scales back any progress made so far in finding common ground over trade with China. Another important release on today’s calendar is Canada’s GDP for March and for Q1 as a whole. The monthly rate for March is expected to have tumbled to -9.0% from 0.0%, which will drive the qoq annualized rate down to -10.0% from +0.3%. At its prior gathering, the BoC announced an expansion of its QE purchases, while last week, inflation data for April missed estimates, with the headline rate falling to -0.2% YoY. Although this may have been due to the collapse in oil prices, combined with an unprecedently low GDP print, it may increase speculation for more easing by the BoC and thereby bring the Canadian dollar under some selling interest. That said, conditional upon further recovery in the broader market sentiment, we would treat such a slide as a correction before another leg of buying, especially against the safe havens, like the US dollar and the yen.
Canada GDP
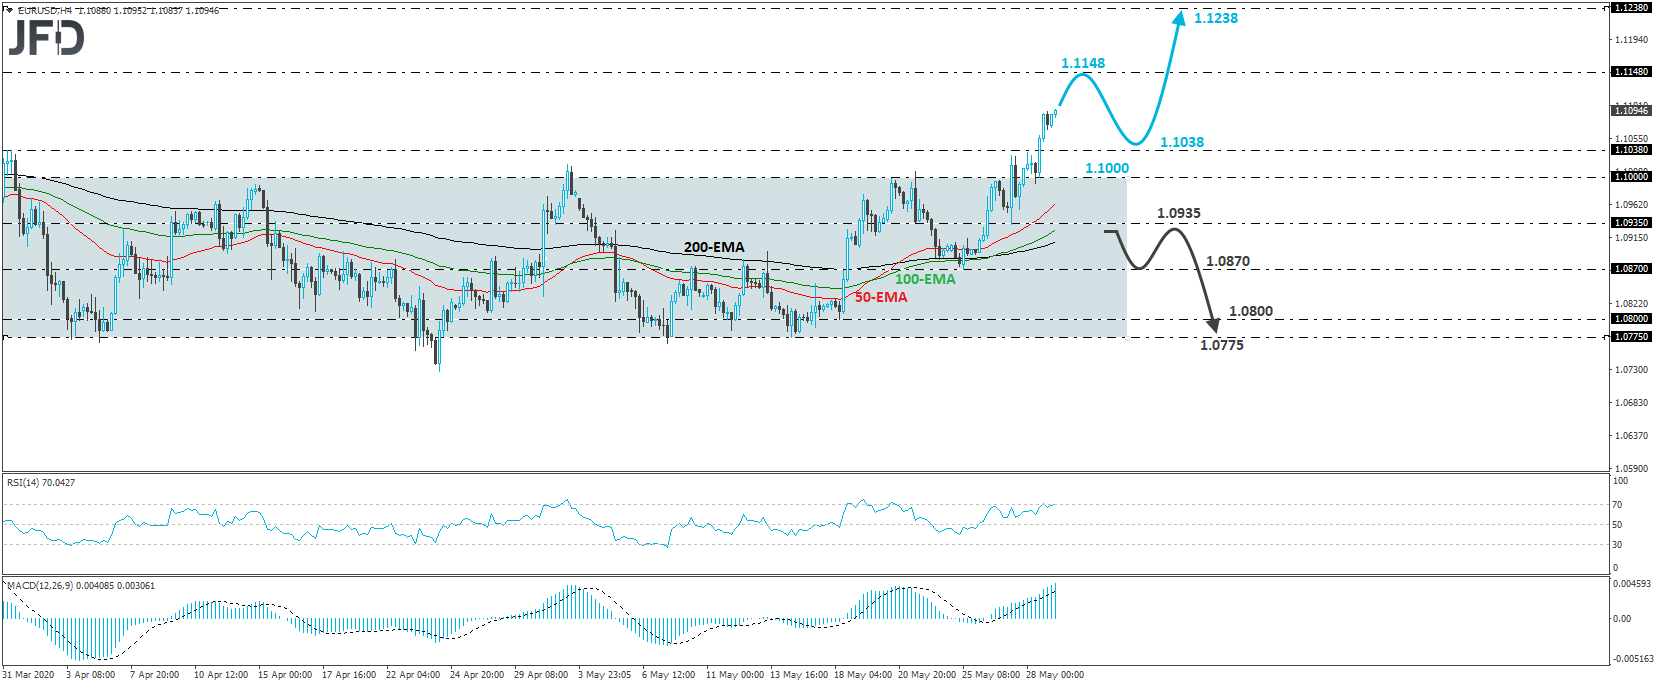
EUR/USD – TECHNICAL OUTLOOKEUR/USD continued climbing higher yesterday, after it cleared the psychological territory of 1.1000, which acted as the upper bound of a sideways range that had been containing most of the price action since April 1st. The pair also managed to overcome the high of that day, at 1.1038, and now looks to be headed towards the 1.1148 zone, marked by the peaks of March 27th and 30th. Having all these technical signs in mind, we would consider the short-term outlook to be positive for now. As we already noted, if the bulls are willing to stay behind the driver’s seat, we could soon see them challenging the 1.1148 zone. They may decide to take a break after such a test, thereby allowing the rate to correct lower. However, as long as the rate stays above the key barrier of 1.1000, we would treat the slide as a correction before the next leg north. The forthcoming positive leg could drive the action above 1.1148, a move that may set the stage for extensions towards the 1.1238 hurdle, defined as a resistance by the peak of March 16th. On the downside, a dip back below 1.1000 would bring the rate back within the aforementioned range. However, in order to start examining whether traders actually want to keep the rate within that range for a while more, we would like to see a break below Wednesday’s low of 1.0935. This could wake up some bears, who may dive towards Monday’s low of 1.0870, the break of which may allow declines towards the 1.0800 territory, or the 1.0775 zone, which is the pre-discussed range’s lower end.
EUR/USD 4-hour chart technical analysis
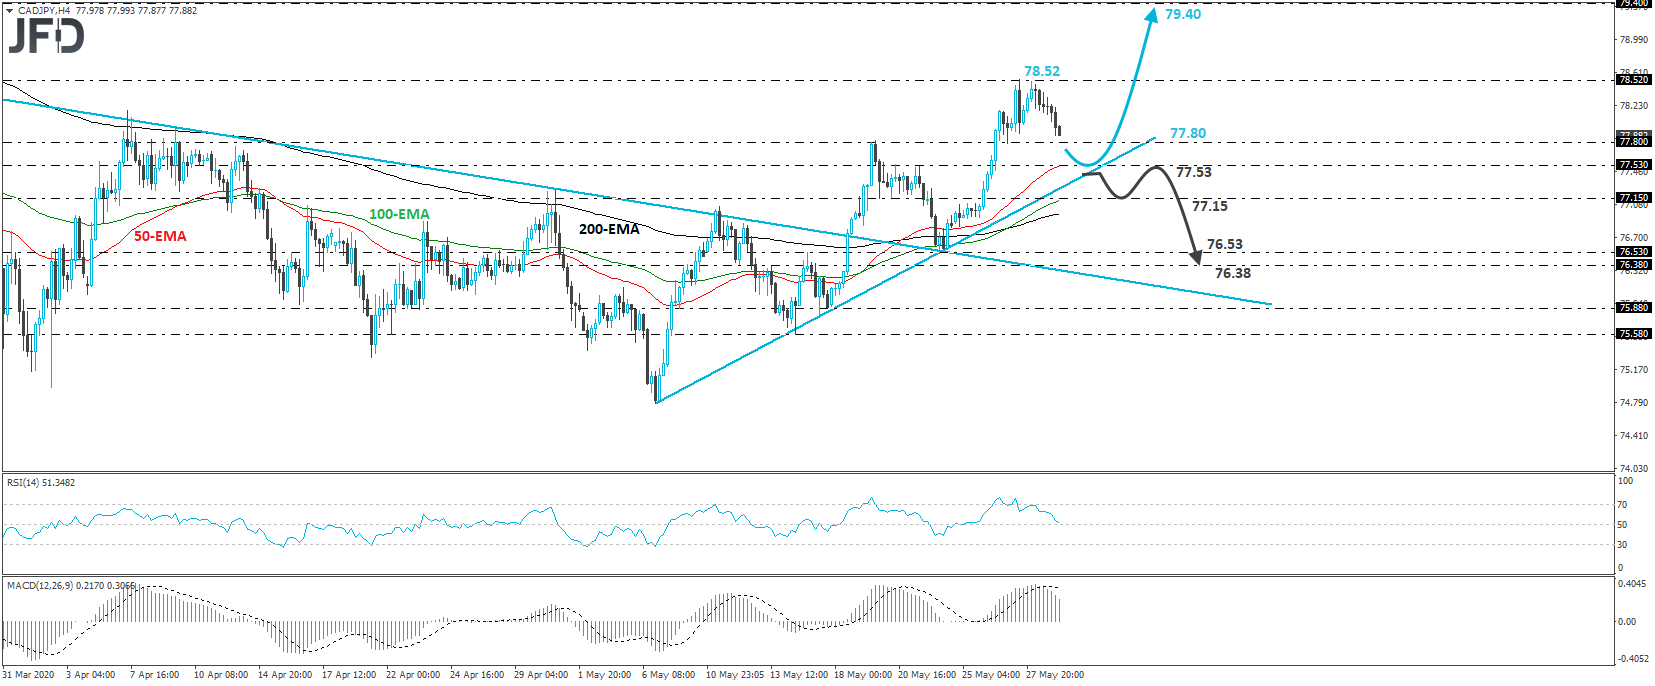
CAD/JPY – TECHNICAL OUTLOOK CAD/JPY traded lower yesterday, after hitting resistance at 78.52 on Wednesday. That said, the pair continues to trade above a short-term upside support line drawn from the low of May 6th, as well as above a prior downside resistance line, taken from the high of March 25th. Thus, despite the latest retreat, we would consider the near-term outlook to still be positive. Further declines may bring the rate close to the 77.53 support and the aforementioned upside support line. This is a territory from which the bulls could take charge again and push for another test near the 78.52 hurdle. A successful break above that zone would confirm a forthcoming higher high and may pave the way towards the high of March 6th, at around 79.40. In order to abandon the bullish case, we would like to see a decisive dip below the short-term upside support line. This may already bring the rate below the 77.53 support level, which could open the way towards the 77.15 barrier. Another dip, below 77.15, could carry larger bearish implications, perhaps triggering extensions towards the 76.53 barrier, marked by the low of May 22nd and the inside swing high of May 15th.
CAD/JPY 4-hour chart technical analysis
AS FOR THE REST OF TODAY’S EVENTSIn the US, we have personal income and spending for April, as well as the core PCE rate for the month. Personal income is expected to have fallen 8.3% mom after sliding 2.0% in March, while spending is anticipated to have tumbled 9.7% mom after falling 7.5%. That said, we would consider the risks of the income rate as tilted to the upside and this is because the average hourly earnings for the month jumped 4.7% mom. With regards to spending, we would consider a larger-than-expected decline as retail sales for the month dropped 16.4% mom. With regards to the YoY core PCE rate, the Fed’s favorite inflation metric, it is expected to have fallen to +1.1% YoY from +1.7%. The case for a notable decline is supported by the core CPI rate for the month, which dropped to +1.4% YoY from +2.1%. With the Fed showing willingness to ease its policy further if needed, a notable slide in the core PCE index may add to the chances of more stimulus.
US CPIs vs. Core PCE YoY
Daily Market Review: Trump to Hold a Conference on China, EZ CPIs and Canada GDP Also in Focus
Disclaimer:The content we produce does not constitute investment advice or investment recommendation (should not be considered as such) and does not in any way constitute an invitation to acquire any financial instrument or product. The Group of Companies of JFD, its affiliates, agents, directors, officers or employees are not liable for any damages that may be caused by individual comments or statements by JFD analysts and assumes no liability with respect to the completeness and correctness of the content presented. The investor is solely responsible for the risk of his investment decisions. Accordingly, you should seek, if you consider appropriate, relevant independent professional advice on the investment considered. The analyses and comments presented do not include any consideration of your personal investment objectives, financial circumstances or needs. The content has not been prepared in accordance with the legal requirements for financial analyses and must therefore be viewed by the reader as marketing information. JFD prohibits the duplication or publication without explicit approval. 72.99% of the retail investor accounts lose money when trading CFDs with this provider. You should consider whether you can afford to take the high risk of losing your money. Please read the full Risk Disclosure - https://www.jfdbrokers.com/en/legal/risk-disclosure .
Trump To Hold A Conference On China, EZ CPIs And Canada GDP Also In Focus
Here is a trillion (dollar) reasons why the US economy is likely to hold up until elections: between now and then, Yellen is likely to drain the Treasury General Account (TGA) and...
Stocks finished flattish on the day, but we are moving into the busiest part of the week. Now that Meta’s results are out of the way, we will have GDP and PCE to finish the...
To be successful, active investors have to watch (and create) indicators that the mainstream media do not follow.Trading is hard, requiring discipline and a strict set of...
Trump To Hold A Conference On China, EZ CPIs And Canada GDP Also In Focus
Add a Comment
Comment Guidelines
We encourage you to use comments to engage with other users, share your perspective and ask questions of authors and each other. However, in order to maintain the high level of discourse we’ve all come to value and expect, please keep the following criteria in mind:
Enrichthe conversation, don’t trash it.
Stay focused and on track. Only post material that’s relevant to the topic being discussed.
Be respectful. Even negative opinions can be framed positively and diplomatically. Avoid profanity, slander or personal attacks directed at an author or another user. Racism, sexism and other forms of discrimination will not be tolerated.
Use standard writing style. Include punctuation and upper and lower cases. Comments that are written in all caps and contain excessive use of symbols will be removed.
NOTE: Spam and/or promotional messages and comments containing links will be removed. Phone numbers, email addresses, links to personal or business websites, Skype/Telegram/WhatsApp etc. addresses (including links to groups) will also be removed; self-promotional material or business-related solicitations or PR (ie, contact me for signals/advice etc.), and/or any other comment that contains personal contact specifcs or advertising will be removed as well. In addition, any of the above-mentioned violations may result in suspension of your account.
Doxxing. We do not allow any sharing of private or personal contact or other information about any individual or organization. This will result in immediate suspension of the commentor and his or her account.
Don’t monopolize the conversation. We appreciate passion and conviction, but we also strongly believe in giving everyone a chance to air their point of view. Therefore, in addition to civil interaction, we expect commenters to offer their opinions succinctly and thoughtfully, but not so repeatedly that others are annoyed or offended. If we receive complaints about individuals who take over a thread or forum, we reserve the right to ban them from the site, without recourse.
Only English comments will be allowed.
Any comment you publish, together with your investing.com profile, will be public on investing.com and may be indexed and available through third party search engines, such as Google.
Perpetrators of spam or abuse will be deleted from the site and prohibited from future registration at Investing.com’s discretion.
Your ability to comment is currently suspended due to negative user reports. Your status will be reviewed by our moderators.
Please wait a minute before you try to comment again.
Thanks for your comment. Please note that all comments are pending until approved by our moderators. It may therefore take some time before it appears on our website.


Add a Comment
We encourage you to use comments to engage with other users, share your perspective and ask questions of authors and each other. However, in order to maintain the high level of discourse we’ve all come to value and expect, please keep the following criteria in mind:
Enrich the conversation, don’t trash it.
Stay focused and on track. Only post material that’s relevant to the topic being discussed.
Be respectful. Even negative opinions can be framed positively and diplomatically. Avoid profanity, slander or personal attacks directed at an author or another user. Racism, sexism and other forms of discrimination will not be tolerated.
Perpetrators of spam or abuse will be deleted from the site and prohibited from future registration at Investing.com’s discretion.