The “talking heads” in the media are saying that the markets are “not supposed to be this high”. Analyst are just now raising their targets for the S&P 500 for the rest of 2017. My long-term target, as of now, is 2550 and possibly even higher. It is now heading into a corrective wave pattern before beginning its’ next new impulsive wave UP.
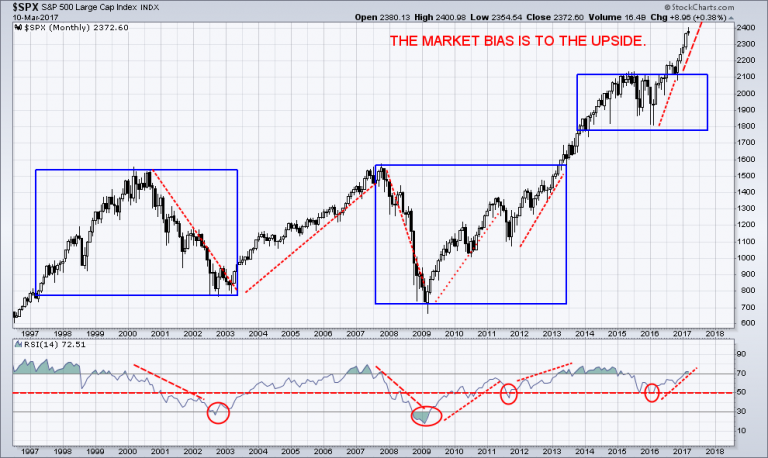
Equities appear to have reached the top of wave three and prices should correct themselves back to my Fibonacci level at 2340 for a pivot low. This long term BULLISH trend is very sustainable.
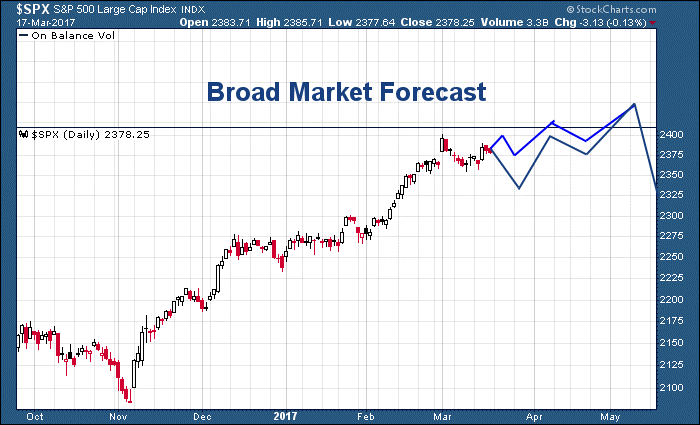
Dips In Price Are Investments “On Sale.”
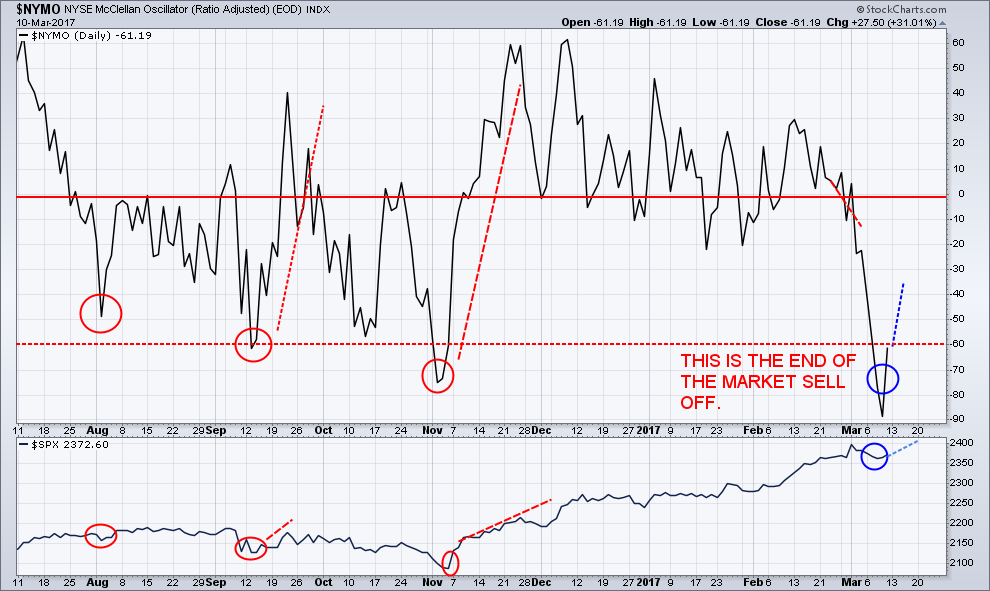
Happy 8th anniversary to the U.S. Bull markets. This is the game that is going on in today’s world of artificially inflated asset classes of stocks and real estate where hyper-liquidity is king.
Overvalued heated markets encourage corporate takeovers and new public stock offerings, which result in huge investment banking fees to Wall Street Banking houses.
Investor Movement Index® (IMXSM): February 2017:
The Investor Movement Index, IMX, is a proprietary behavior-based index created by TD Ameritrade Holding Corporation (NASDAQ:AMTD). It was designed to indicate the sentiment of retail investors. The IMX rose to 6.15 in February of 2017 whereas it increased above 6.0 for the first time ever and reached its’ all-time high. TD Ameritrade clients were net buyers during the February 2017 IMX period while increasing their exposure to equity markets. Net buying of equities, as well as some widely-held stock names saw their volatility rise relative to the overall market. The CBOE Volatility Index, VIX, which measures implied volatility of the S&P 500, dropped below 10 during that still remains historically low. It provides a snapshot into individual investor behavior.
Will The FED Kill The Bull Market Rally?
The FED will continue to keep “loose” monetary policy, indefinitely, as they do not want to repeat their mistakes of 2000 and 2006. The markets believe that President Trump will create a new economic “miracle”. Implementing new fiscal initiatives is the next and last option to implement.
I believe that Infrastructure Spending will be the new asset class to invest in for the future. A rate hike this month of an “immaterial” 25 basis points does not change the BIG picture that the FED will lower all three of these “immaterial” hikes down the road or even go directly into the markets and purchase stocks and bonds on the next major downturn.
Federal Chairwoman Yellen and Company is under pressure to do some face saving. This is not an indication by them to push ahead with any material future FED FUNDS RATE hikes. This Federal Funds rate hike is already factored into all of the markets today. It is much to do about nothing!
With languishing Real GDP, The FED cannot and will not raise the FED FUND Rates in any material manner!
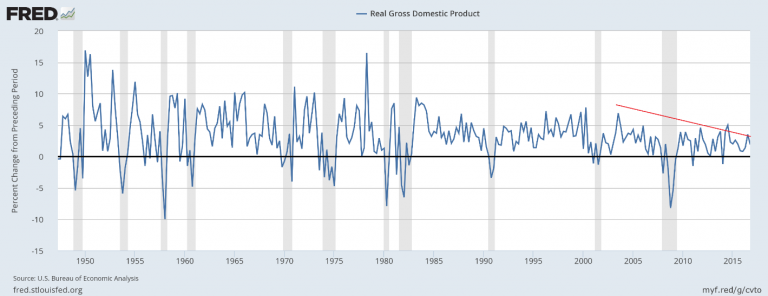
Federal government current expenditures: Interest payments
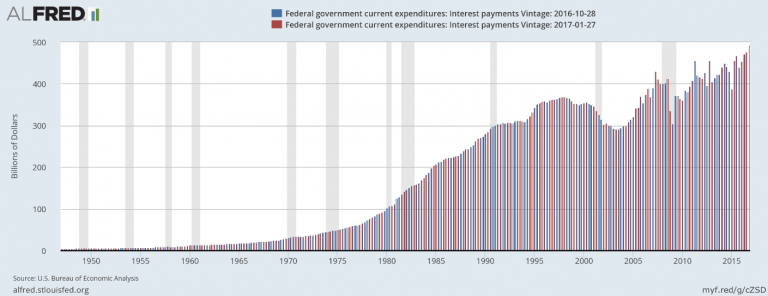
The Federal Reserves’ easy-money policies of debt monetization, and zero interest rates, have largely absorbed and papered over the debt crisis that brought the U.S. economy to its economic knees in 2008. Therefore, that means more deficit spending. The FEDS balance sheet, Treasury and mortgage debt, has grown by 425% since 2007/2008.
The FEDS easy-money policies have made the 2% richest even richer, but the reality is that the middle class has been almost entirely left behind. Fifty million Americans remain below the poverty line. The number of food stamp recipients have increased over 40% in the last six years.
There are ways to take advantage of these fast moving markets to earn a steady income or grow your trading account. That is through our Momentum Reversal Method (MRM)
Our New Paradigm Trading Results:
VelocityShares 3x Long Natural Gas linked to S&P GSCI Natural Gas Excess Return (NYSE:UGAZ) 74%
Direxion Daily Energy Bull 3X Shares (NYSE:ERX) 7.7%
Direxion Daily Gold Miners Bull 3X Shares (NYSE:NUGT) 112%
Global X Uranium (NYSE:URA) 2.7%
Our most current active trade was ProShares UltraShort Bloomberg Crude Oil (NYSE:SCO): In less than 24 hours, we banked a quick 7.8% in profit!
I am currently monitoring a list of hot stocks and sectors to enter new trades in the next day or two.
