Bed Bath & Beyond Inc (NASDAQ:BBBY):
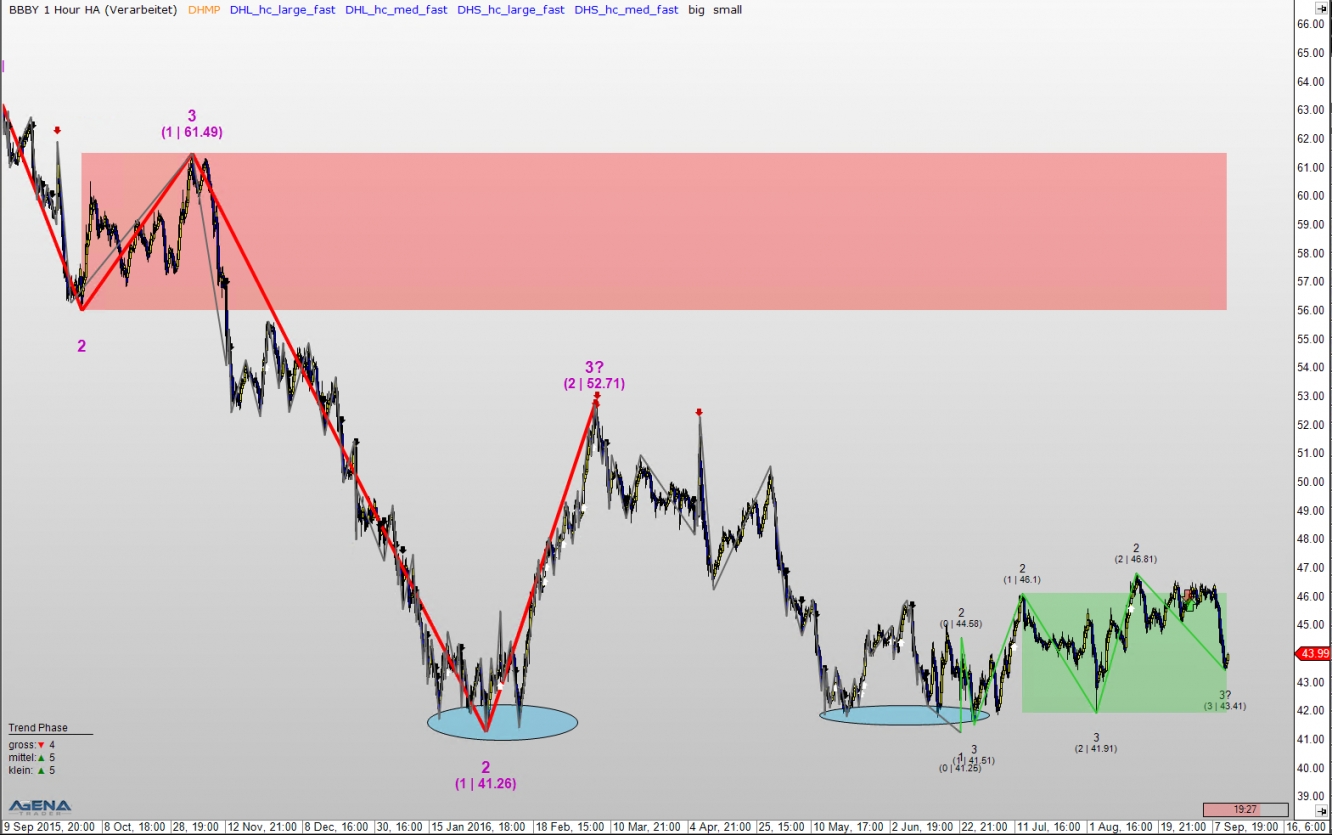
This stock has been facing sharply downwards since last Thursday, and there is no reason to expect this to change any time soon, since we are dealing with a large, young downtrend here.
In the medium trend of the hourly chart, on the other hand, we see an intact upward trend that is currently running rapidly back into the green correction zone. Since the large, red correction zone is far away, one could venture a short-term long trade.
Anyone who is sure of themselves and has their nerves and their money management under control can cut off a piece for themselves here and hazard an entry at $44.00. The target should be located at point 2 at $46.81, for there we can then expect a reversal in the southerly direction. Alternatively, we could also anticipate a more considerable correction. In this case, the area from $56 to $61.50 would then be the target, before the superior downward trend then continues on once more.
Rheinmetall AG (DE:RHMG):
When it comes to the venerable defense company Rheinmetall, founded back in the year 1889, with its headquarters in Düsseldorf, we are talking about a current market capitalization of 2.78 billion euros surrounding a medium-size, internationally oriented German enterprise. Accordingly, the group – which, alongside its focus on the defense industry, also covers the field of automotive supplier with the corporate division “KSPG” (Rheinmetall Automotive since 05.09.2016) – is listed in the German Mid-Cap Index MDAX. Nevertheless, an in-depth observation made by the classic Dow Theory-oriented trader with a short to mid-term time horizon should not be skipped.
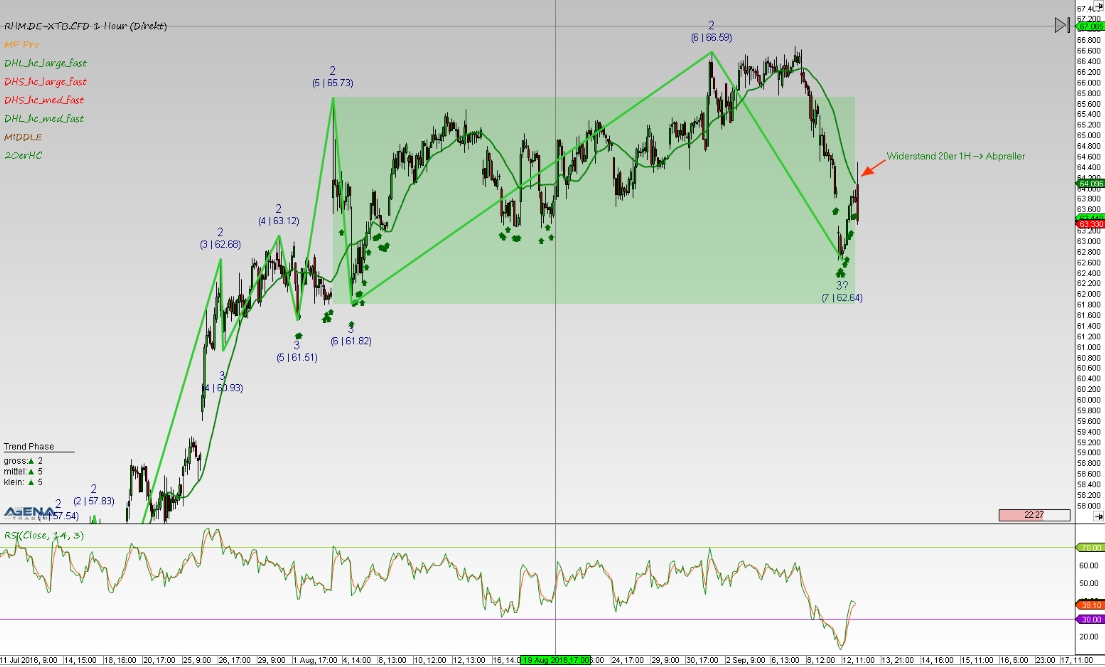
The primary principle of the Dow Theory states that as far as possible, all 3 trends in the intended trading timeframe, as well as the directly superior trend in the higher timeframe located directly above (here the small trend in the daily basis), should be pointing in the same direction. For an intended trade in the 1H chart, this would mean that not only the small, but also the medium and large trend should be going long, in alignment with the existing LONG trend in the small trend level in the daily chart.
Although all trends in the hour are in an upwards movement in the specific case of the Rheinmetall stock, the small and medium trend, which are significant when taking reasonable risk and money management into consideration, are already in the 8th and 7th correction arm, which reduces the probability of a favorable long trade for us almost to a minimum. The 20 location point line from the hour, which is already falling steeply, also argues against a long trade. The small upward-facing trend in the daily basis, which is only in its 2nd correction, and the medium, not-yet valid long trend do nothing here to change the fact that the telling Relative Strength Index (RSI) is showing strongly declining momentum with accompanying strong negative divergences that are already visible to the naked eye. This means that the RSI is no longer depicting the last upward movement in the chart, but is dropping away. To sum up the whole situation, in order not to put unnecessary strain on the trading account: “Hands off this value at the moment”.
Infineon Technologies AG NA O.N. (DE:IFXGn) is Germany’s largest and Europe’s second-largest semiconductor enterprise. Their headquarters is located in Neubiberg near Munich. The company was founded on the 1st April 1999.
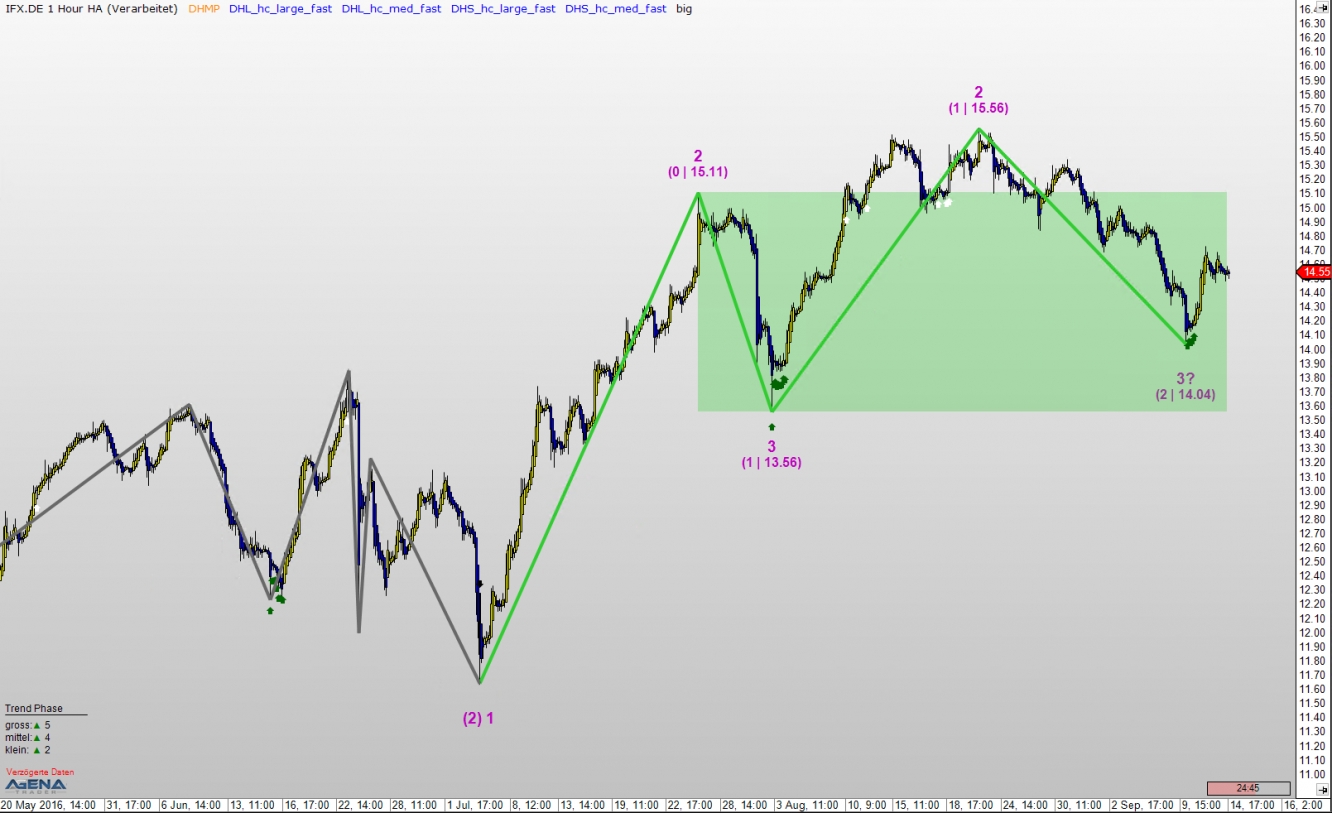
This DAX-listed company is on the edge of a new upswing to the top. If one observes the picture in the large trend of the hourly chart, one sees a very young upward trend, whereby the price has already gone deep into the green correction zone here and is now getting ready to start the next upward movement. With an entry at approx. €14.70, one can speculate on a trend continuation. The stop should be located beneath the green correction zone; the first target is located at about €15.56.
Disclaimer:
Exchange transactions are associated with significant risks. Those who trade on the financial and commodity markets must familiarize themselves with these risks. Possible analyses, techniques and methods presented here are not an invitation to trade on the financial and commodity markets. They serve only for illustration, further education, and information purposes, and do not constitute investment advice or personal recommendations in any way. They are intended only to facilitate the customer's investment decision, and do not replace the advice of an investor or specific investment advice. The customer trades completely at his or her own risk.


