I trade futures and options for my own account. My initial time horizon for a trade is usually a few days to a few weeks. Sometimes, if my view of the market is working I will maintain a position for months. I believe net profits over time come from disciplined risk management...not from having a great crystal ball. I don’t use much leverage and I know where/why I will kick out a losing trade before I initiate the trade. I manage risk by limiting size, using stops and trying to avoid too much concentration/correlation.
My trading P+L seems to be a little “streaky”...that is I’ll have a run of winning trades and then a run of losing trades. Losing trades outnumber winning trades over time but the average size of my losing trades is smaller than that of my winning trades. Every once in a while I have an outsized winning trade. My risk management process is designed to keep me from having any outsized losing trades...but sometimes I do. Trading is a marathon not a sprint. You have to find your own way to trade...but with every trade you make you have to know exactly what you are going to do if you’re wrong. You never know what’s going to happen.
In the early 1980s I was the currency analyst for one of the largest American commodity brokerage firms. I provided “fundamental” research to our brokers over a telephone “broadcast” system and internal teletype system. I traded my own accounts very aggressively via that “broadcast” system so that all of our brokers in North America and Europe could hear what I was doing. I did daily market commentary on a popular radio station and the TV news people were regularly in my office to get my market opinions.
My thinking at that time was very much focused on “why” the market was moving. I developed research habits in those days that I still maintain...but these days I’m much less focused on “fundamental” research and I’m much more interested in what Jim Dines calls “Mass Psychology” because I believe that’s what really moves the markets.
Market Psychology (as I call it) seems to move in waves...not smooth symmetrical waves...but rather spiky waves...whereby, for instance, a market will rally with increasing momentum and then reverse...sometimes sharply.
Robert Prechter (Elliott Wave Principle) told me years ago that the “social mood” drives the market...not the other way round. And it seems to me that the “social mood” is turning these days...whether we are looking at the continuing spread of the virus and the knock-on effects that go with that...or the current social/political unrest and how that may have its own knock-on effects on the November elections.
One of the ways I try to get a “feel” for market psychology is by watching how a market reacts to “news.” A bullish market overlooks bad news and embraces good news. For instance, the recent “risk-on” rally took the stock market sharply higher while the “news” was of massive job losses and a very weak economy.
I pay close attention to intermarket relationships. Lately, I’ve been writing that “it’s all one market” as “risk-on” market psychology took stocks (some more than others) and commodities higher while driving the US dollar down. Intermarket relationships can give me a good “feel” for market psychology...especially when a number of different markets all reverse direction on or around the same date...something I call a Key Turn Date.
I’ve thought that the “risk-on” rally from the March lows was a classic bear market rally...coming after the brutal month-long “risk-off” crash from the February All-Time Highs. It lasted much longer than I thought...perhaps accelerated by millions of new retail accounts (and massive stimulus!) but the past couple of weeks I’ve been showing charts that may indicate that the bear market rally is over and a new down leg is beginning. I’ve been trading my accounts with that idea in mind. The major American stock indices closing Friday right on their lows adds to my bearish view.
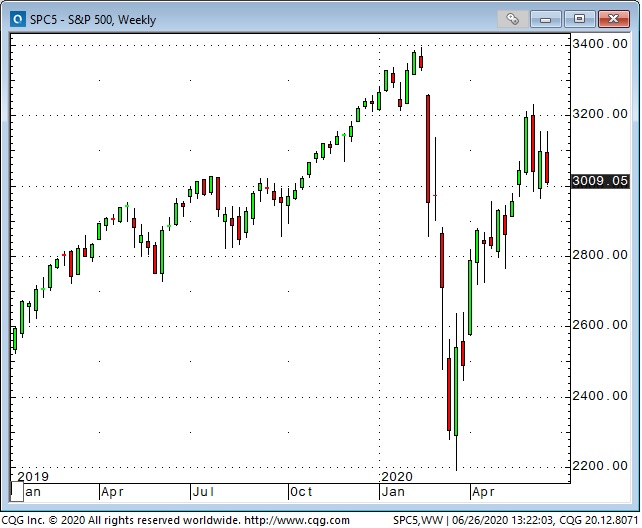
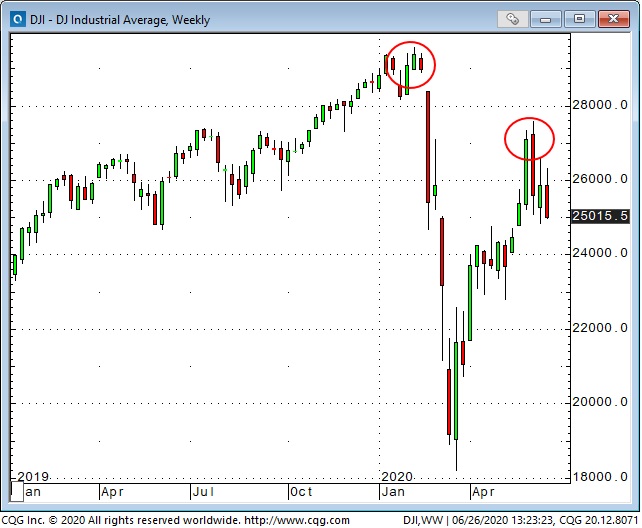
I wrote last week about “M” shaped topping patterns (with lower right shoulder) being one of my favorite signs that a rally may be ending and a down leg developing. A “W” pattern works in reverse for market bottoms. The Weekly DJIA chart shows an “M” top in a monthly time frame while the daily chart shows an “M” top in a shorter time frame.
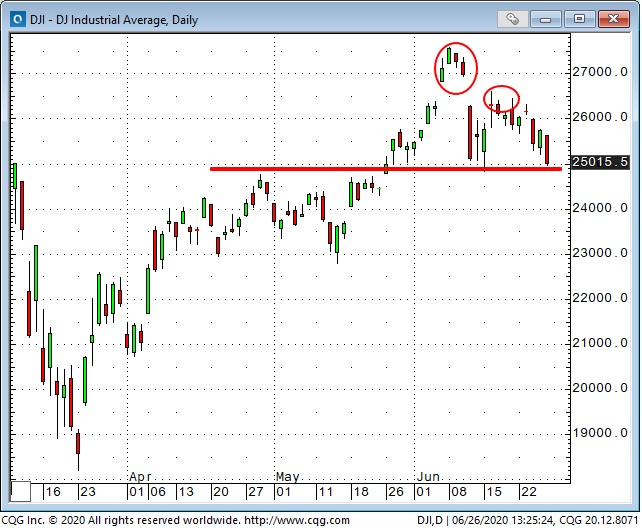
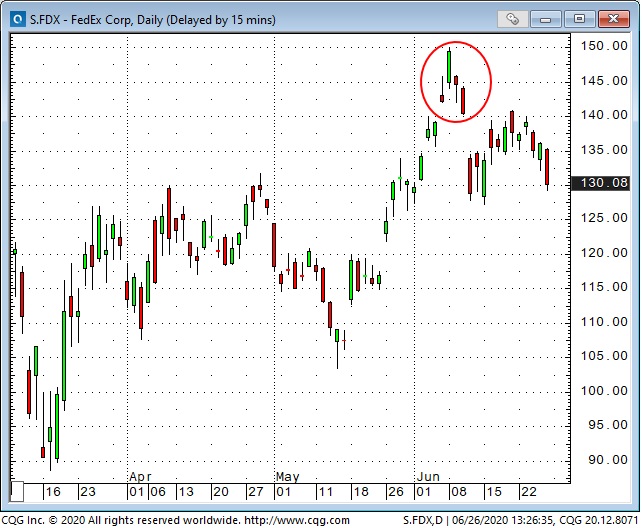
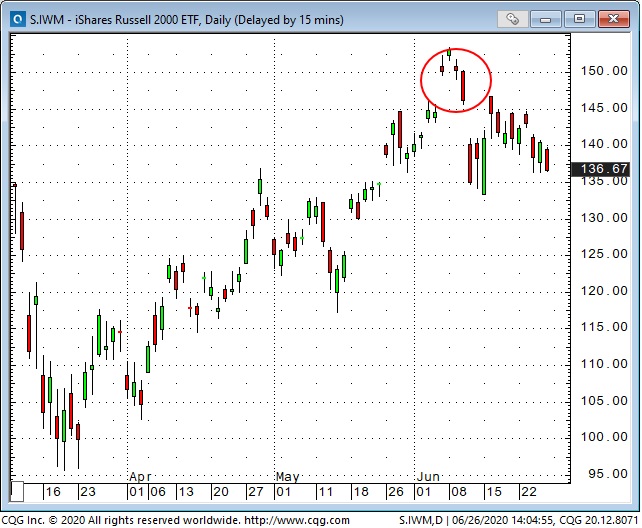
Two weeks ago I showed a few examples of what I called Ominous Island Reversals which may also have been signaling an end to the bear market rally. Those Island Reversals seem to be working so far.
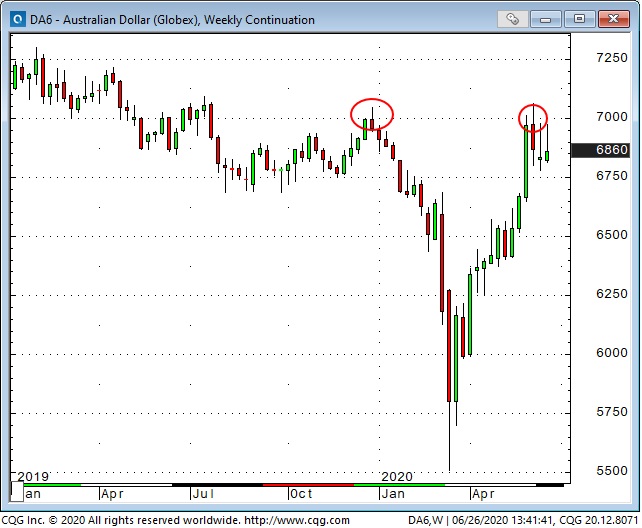
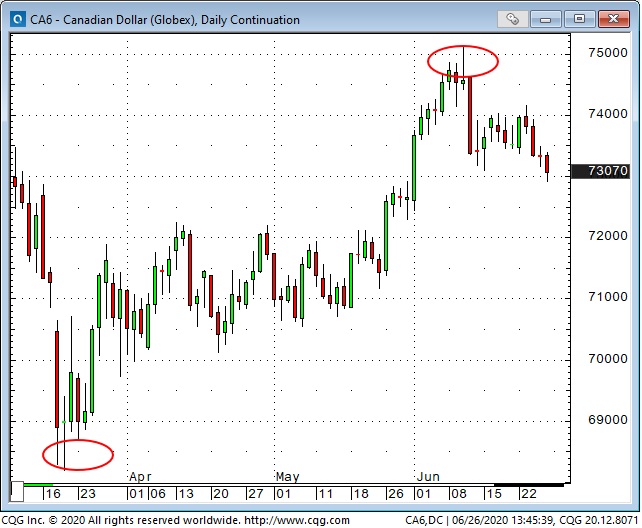
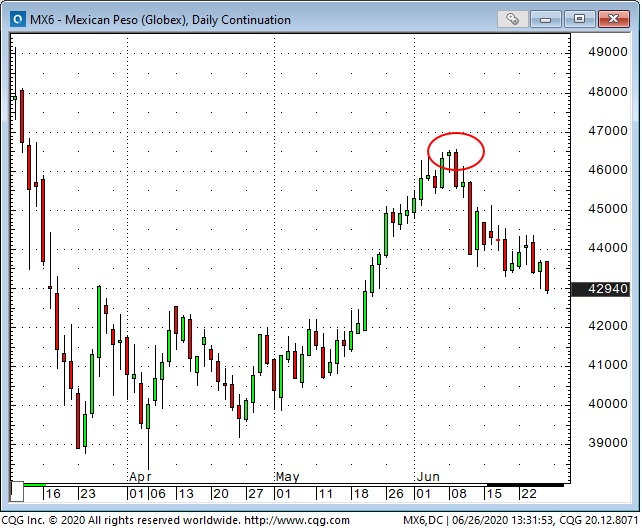
The Australian dollar and the Canadian dollar (and EM FX) have moved broadly in line with “risk-on/off” sentiment the past few months...falling with the stock market in Feb/March and rallying thereafter. If that close relationship continues (and it doesn’t have to) and if the stock market takes another leg lower then there may be good trading opportunities buying the USD against commodity and EM currencies.
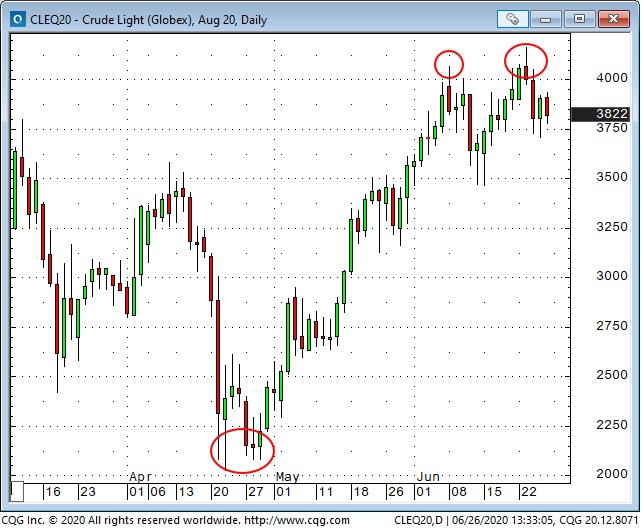
I could say much the same thing about crude oil.
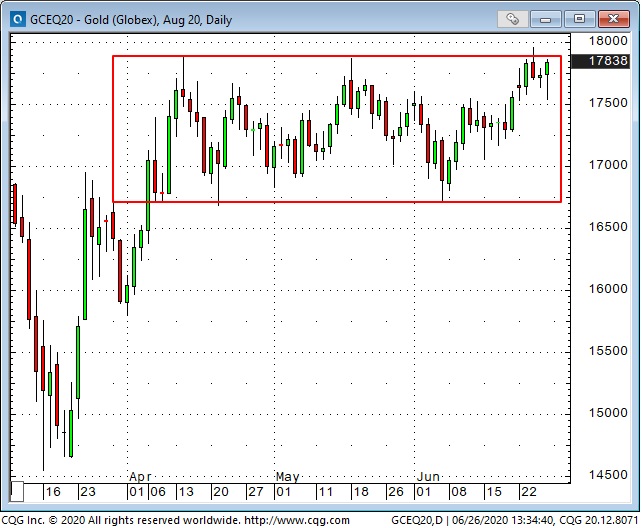
The gold market has been very choppy within ~$100 range for the past couple of months but it broke out to a new multi-year high this week. It’s up ~$400 from last year’s lows and it seems to me that negative real interest rates, fears about the precarious political/social/financial environment and concerns about possible run-away future inflation / currency debasement have driven investors to take record-sized long positions in global gold ETFs. I can’t disagree with that but the very choppy day-to-day price action has kept me from buying gold. Trading is not a game of perfect!
