Low option implied volatility = low uncertainty
Option markets are currently pricing the lowest level of uncertainty we’ve seen since February. That makes me nervous because I think some of the assumptions people have made will be in the “just ain’t so” category.
Option markets price uncertainty via implied volatility (Vol.) In this chart of Nasdaq 100 option Vol the spike during the March panic was the highest since 2008. The high around the Key Turn Date in early September came as the index hit All-Time Highs after ripping higher during the summer.
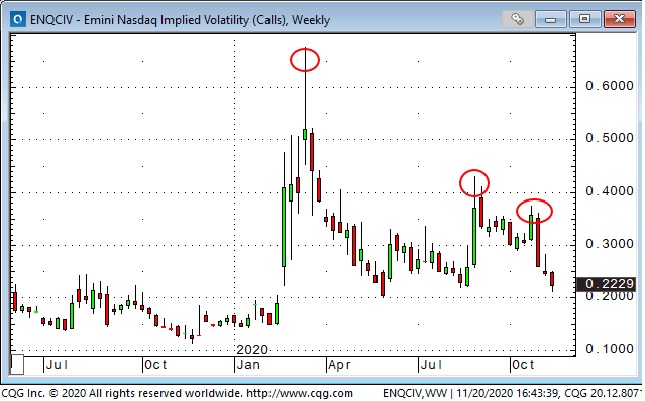
The high at the end of October came as markets were de-risking ahead of the election and since then Vol has steadily trended lower. The current low Vol levels imply a much lower probability of a big price change than what people were prepared for just 3 weeks ago..
What assumptions have people made that could go wrong?
Well, aside from some truly exogenous event I think the biggest potential shock to current assumptions centers on Trump. Just how unpredictable will he be over the next 2 months?
The idea that vaccines will be a “silver bullet” is another popular assumption that could go wrong. I hope the vaccines will stop the spread of the virus but there’s a huge gap between discovering vaccines and widespread effective vaccinations.
My view over the past several months has been that the virus will keep spreading and that will lead to economic weakness which will eventually weigh on bullish equity market psychology.
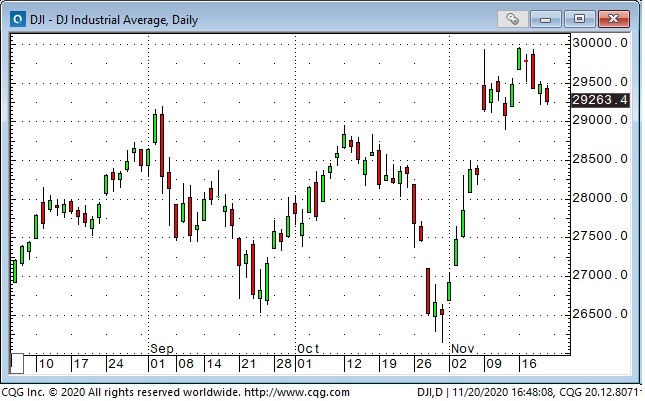
I was short stock indices during the late October break, did nothing during election week and then got back to shorting again after the Pfizer (NYSE:PFE) vaccine rally. My reasoning for trading from the dark side is that the equity market is priced for perfection with the Dow Jones Industrial Average up 4,000 points in just over 2 weeks.
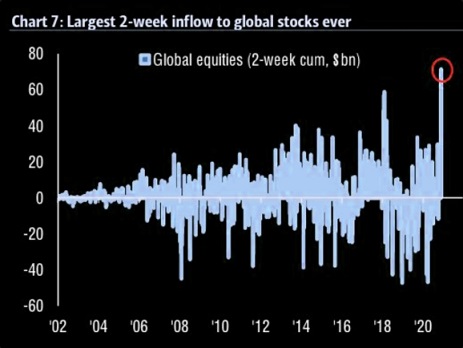
Money has poured into stocks the past 2 weeks
The prospect of vaccines being a major “game-changer” and the prospect of a Biden Presidency with a Republican Senate spurred a record flow of money into equity markets the past 2 weeks. Bob Farrell reminds us that the public always buys the most at the top.
Major Stock market indices at All-Time Highs are bad news for folks who like to be short stocks.
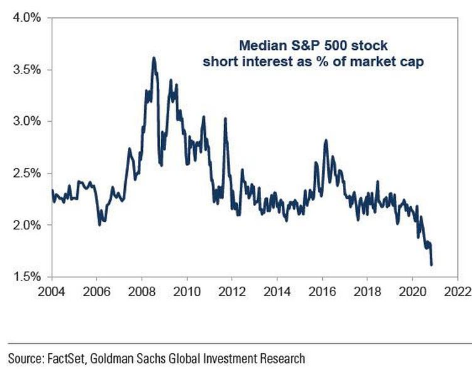
The US housing market has been very strong thanks to the lowest ever mortgage rates. The housing market has a huge “multiplier” effect that ripples through the economy.
The bond market sees things differently
The bond market seems to be pricing in the prospect of a near term economic downturn while stocks are looking past that to better days sometime next year.
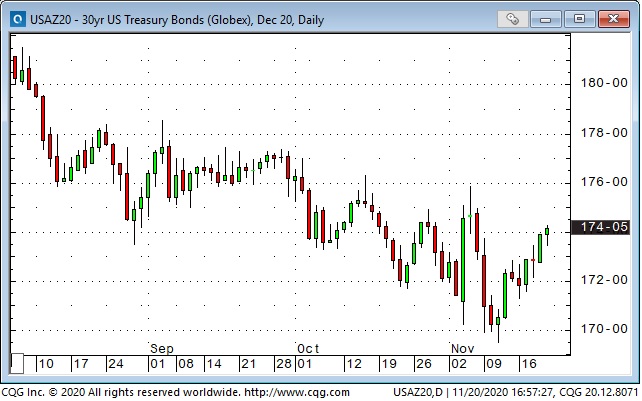
I bought TNotes last week after they had been clobbered by the Pfizer news and sold them this Friday. (It was much easier to sit with a long TNote position than a short equity index position – thank you Raoul Pal!)
A weaker US dollar is a popular assumption
The US Dollar is widely assumed to weaken next year (positioning, sentiment and consensus forecasts.) Citigroup Inc (NYSE:C) is forecasting USD down 20% in 2021. The reasoning seems to be that vaccines will revive global growth, Biden’s policies will hurt the USD and the Fed will remain dovish while the Rest Of The World grows faster than the USA.
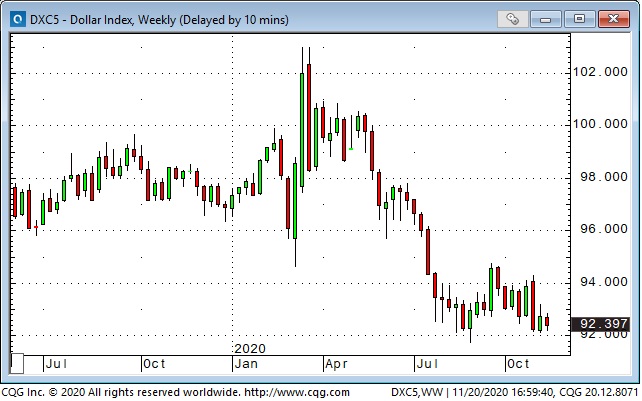
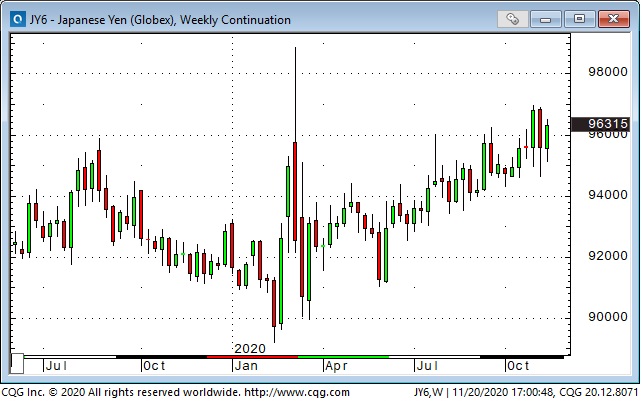
The US Dollar Index is near 2-year lows. Currency market Vol is very low, the Euro has been in a narrow sideways range for 4 months but the major Asian currencies have been trending higher. Perhaps the anticipated “adjustment lower” in the USD will come against Asian currencies rather than against European or commodity currencies.
The Mexican Peso continues to intrigue me. It’s rallied ~25% from its March lows and seems to have little short-term correlation with any other markets. Since the Peso crisis in 1994 the Peso has fallen ~70% against the USD in a stair-step fashion: a quick sharp fall followed by a multi-month rebound.
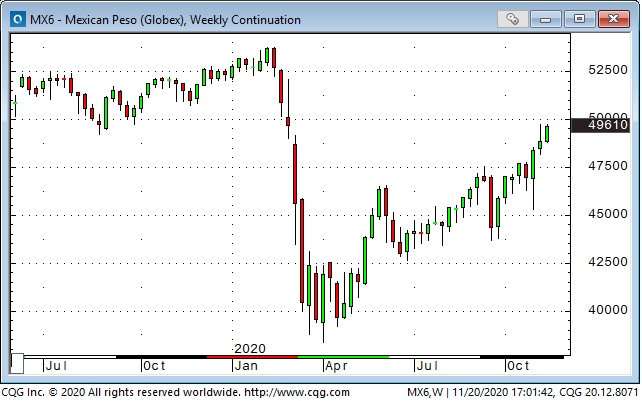
Current s/t Mexican interest rates are ~4.5% against zero in the USA. I’ve long believed that there may be a lot of “hot money” in the SW USA that flows into Mexico after the currency has a sharp fall (it dropped ~30% in March) in a “reaching for yield” play.
Gold hit with bearish news
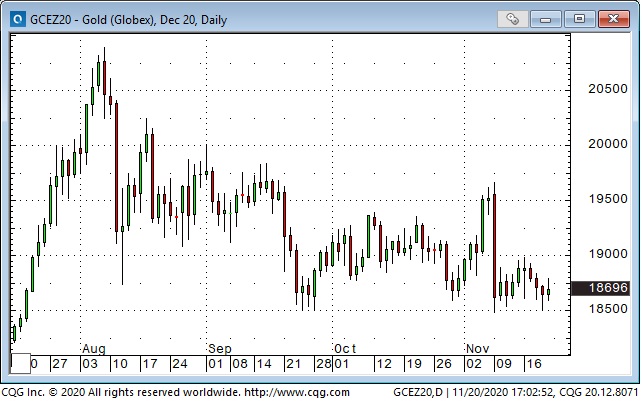
Gold was clobbered >$100 on the Pfizer news and is obviously at risk of breaking important support around $1850. The gold ETF market has seen modest selling the past couple of weeks (after massive buying during the $600 surge March to August.)
WTI crude oil up on hopes of a demand rebound
WTI crude oil has been highly correlated with the S+P over the last month. It tumbled the last 2 weeks of October then reversed sharply higher as November began. It surged ~$6 (16%) following the Pfizer news on hopes that the vaccine would spark a global demand rebound, especially for transportation fuels.
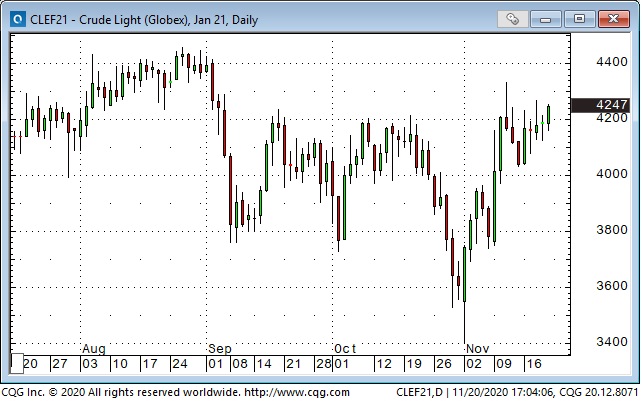
My view has been that WTI has been a lack-of-demand story. Global demand is down ~10% this year from last year and OPEC+ is forecasting that demand for 2021 will be ~4% below last years’ demand. OPEC+ meets Dec. 1 and they will try to keep a lid on production. OPEC export revenue has fallen by ~2/3 since 2012 (2020 revenue ~$350B) so producers have no choice but to keep pumping.
Commodity markets rally
Copper ended this week at a 2-year high ~$3.30 up >50% from 4-year lows in March. Soybeans hit a 4 year high just below $12 bushel, up ~50% from April lows.
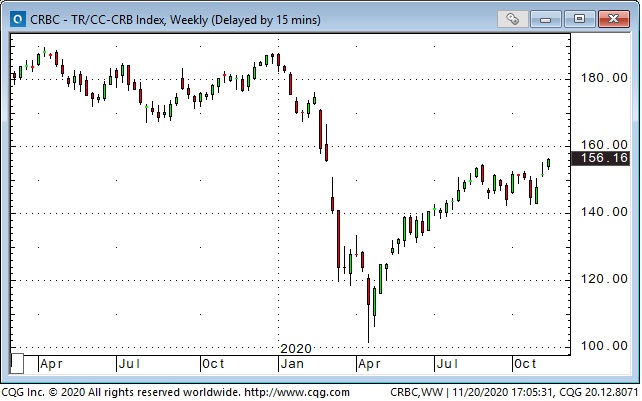
The broad CRB commodity index hit a 27-month high this week up ~37% from the 12-year lows in April. This year’s rally came after a brutal 9- year bear market that took the CRB down >50% from the All-Time High in 2011. Maybe that 12-year low this spring was THE low for the commodity market.
