A Key Turn Date occurs when a number of different markets all reverse direction at the same time...giving us a very valuable window into market psychology. At the risk of being scorned by psychologists, I’d say that a KTD may be an example of synchronicity in the markets...when “meaningful coincidences” are a manifestation of some sort of “universal” decision making.
I’ve always been fascinated with inter-market relationships...for instance, if crude oil is trending lower I would expect the Canadian dollar and the Norwegian Krone to be soft...and if they aren’t I would look for reasons why. When a number of different markets all reverse direction on or about the same date the “not so subtle” message is that something BIG has happened...as was the case around March 23rd following the Fed’s, “Whatever it takes” message.
The March KTD signaled that market psychology was turning away from fear and had begun to move toward greed. “Risk-off” was being replaced by “risk-on.” This pivot created an extreme “V” shaped reversal on the price charts...which is very hard to trade.
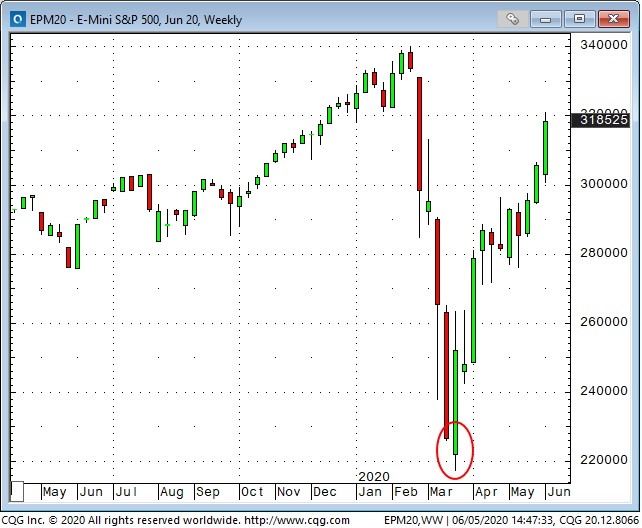
As the “risk-on” market psychology was sustained following the March KTD many people, including me, thought we were seeing a bear market rally...so we either didn’t buy into it or we shorted it...anticipating that “bullish enthusiasm” would hit a brick wall and fear would return. At the very least we anticipated that the “risk-on” rally would have a correction. Such a correction would result in some sort of a “W” chart pattern which would be a confirmation that a bottom had been made.
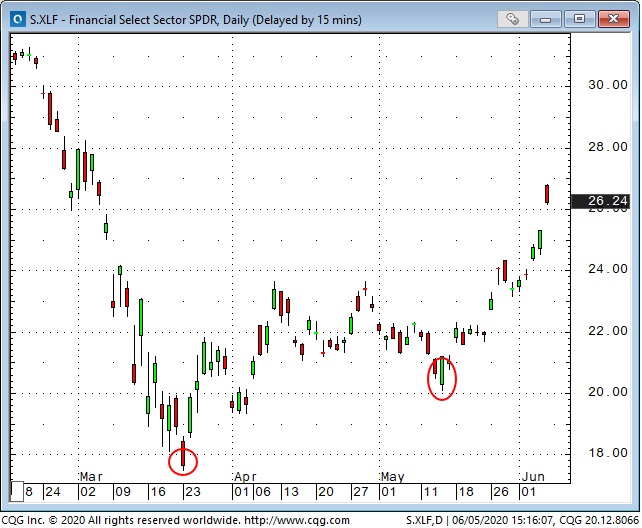
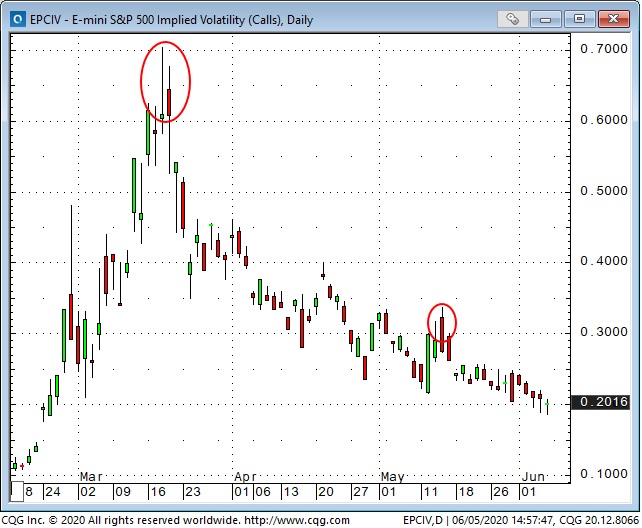
Actually we did have a “correction” in the “risk-on” rally that showed up as a 2nd KTD in mid-May (albeit much less obvious that the March KTD.) This 2nd KTD may have been a confirmation that the “psychological lows” were made in March...that the first leg of the “risk-on” rally was from mid-March to the end of April and the 2nd leg began in mid-May. The important thing is that following the 2nd KTD market psychology had a greater willingness to take on risk and/or to “divest” risk hedges.
The Financial Select Sector ETF (NYSE:XLF) made a low in mid-March, rallied but then rolled over into the mid-May KTD...since then it has had a stronger 2nd leg rally.
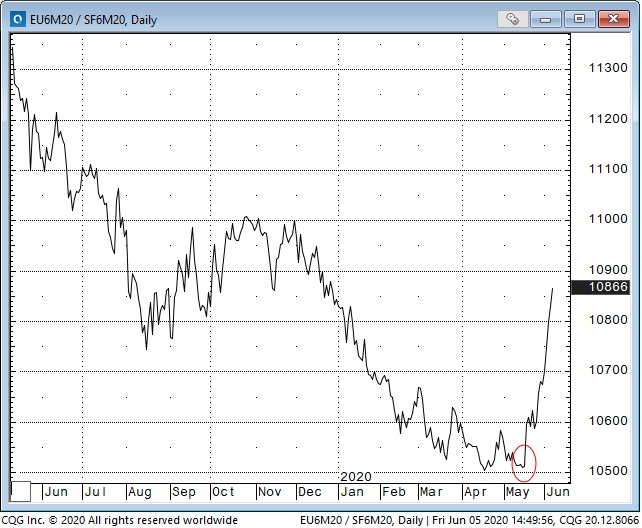
The Euro/Swiss spread is a classic risk barometer. The euro has been falling steadily against the Swiss franc for more than 2 years. It turned sharply higher in mid-May.
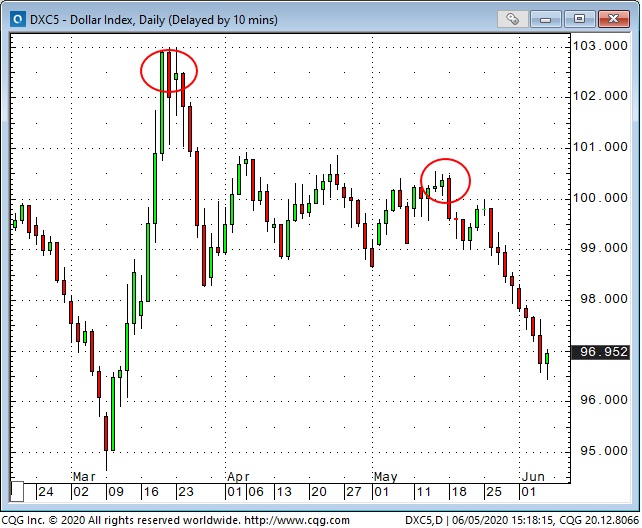
The US Dollar index rallied hard into the mid-March KTD as capital sought safety. For the next 2 months the USDX chopped sideways but it has been weaker since the mid-May KTD...as “risk-on” market psychology sells USD and buys other currencies.
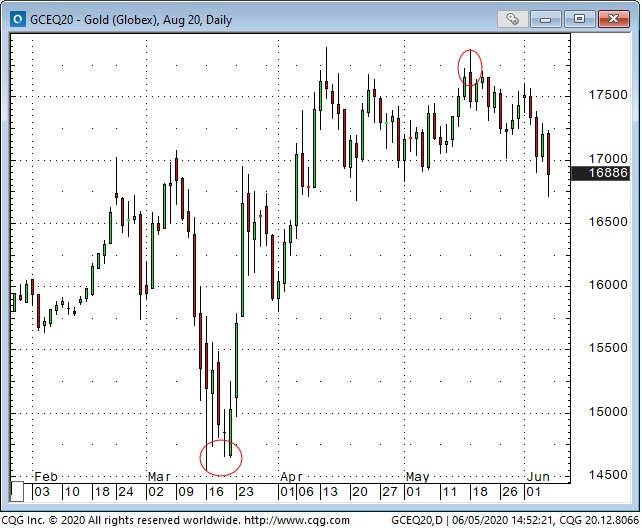
Gold fell ~$250 from early March into the mid-March KTD lows...then rallied to new highs by mid-April. It made an 8 year weekly high close on the 2nd KTD in mid-May but has drifted lower since then...perhaps as market psychology sees less need for a risk hedge at this time. (Note: global buying of gold ETFs surged in April and May to an All-Time High...people bought more gold ETFs in the first 5 months of this year than in any previous full year period.)
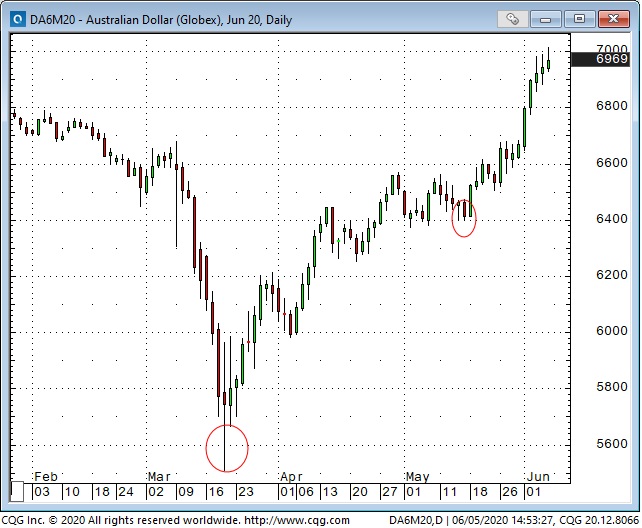
The Australian dollar and the Canadian dollar both tumbled hard in early March but reversed sharply on the mid-March KTD. Their rally ran out of steam late April / early May but they both began a 2nd leg higher on the mid-May KTD.
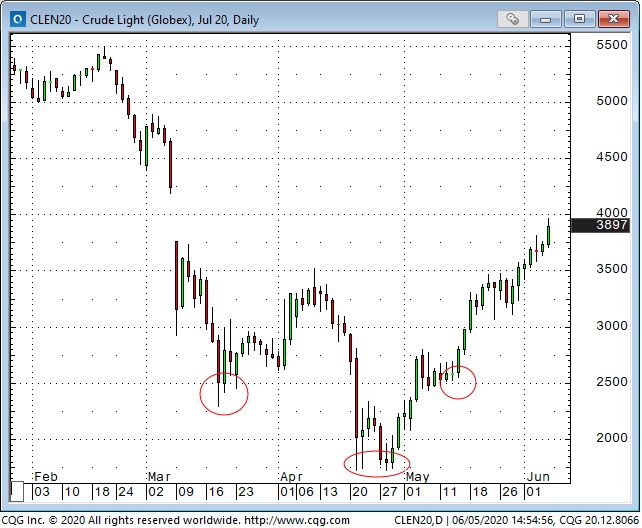
WTI turned higher with a lot of other markets in mid-March but was beset with its own unique problems and made a lower low in late April. The initial rally from those lows stalled in early April but then a 2nd leg higher began on the mid-May KTD.
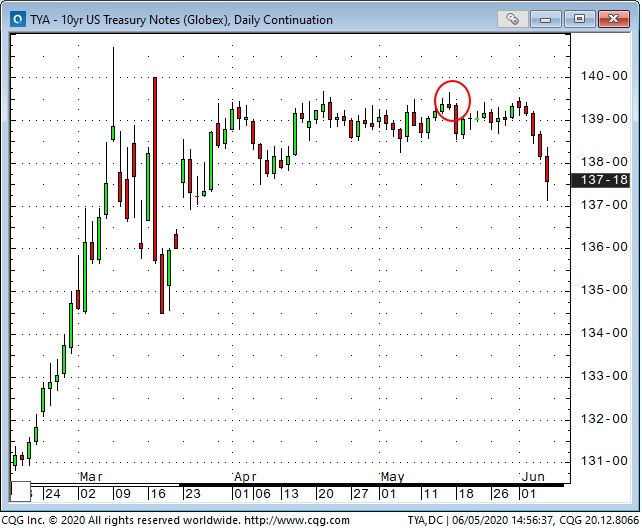
The 10 year Treasury note had ignored the “risk-on” rally in the equity markets throughout April and early May, but prices reversed down on the mid-May KTD and took a noticeable slide lower this week.
Stock option volatility rose to astonishingly high levels (the existential fear of a pandemic) then reversed on the mid-March KTD. Vol rose again in mid-May but quickly reversed on the 2nd KTD and has subsequently fallen to the lowest levels since early February.
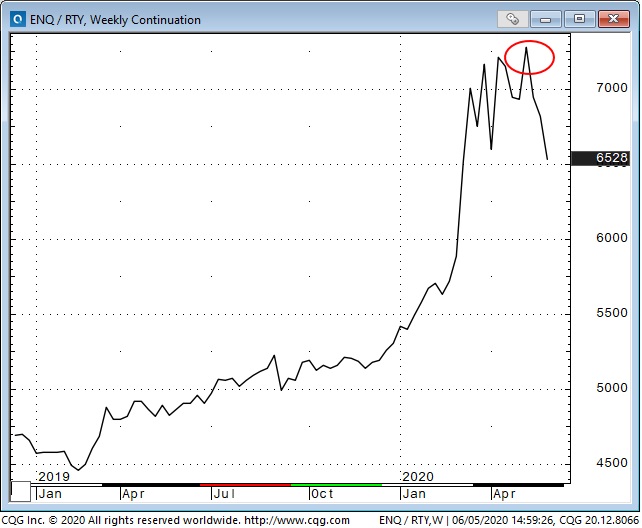
The Nasdaq 100 was flying relative to the Russell 2000 after the mid-March KTD (see my May 16th TD Notes.) Since then there has been a relative “rotation” out of the leading tech stocks and into the “broader market” as market psychology has been willing to take on more risk.
My short term trading: I ended last week short CAD and was stopped for a small loss very early Monday morning. I’ve had a string of small losses the past few weeks trying to “catch” a reversal in the “risk-on” mood. I’m flat at the end of this week.
