The US Dollar Index (USDX) had its worst month in a decade in July...falling more than 5% to a 2 year low. USDX has dropped more than 8% from mid-May when Macron/Merkel launched their plan to create a jointly guaranteed recovery fund for Europe...which launched a sizzling euro rally on thoughts that this might be a major step towards a European fiscal union. USDX is down ~10% from the 40 month highs it hit in late March when stock markets were crashing and capital surged into the USD for safety.
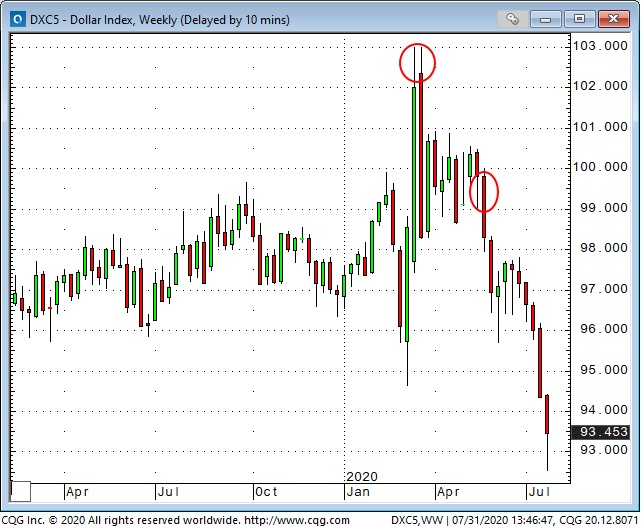
If you take the perspective that markets rise when buyers are more aggressive than sellers...and fall when sellers are more aggressive than buyers...you might ask yourself, “Why were US Dollar sellers so aggressive?”
We think USD sellers were motivated by these popular narratives: 1) the mid-to-late March flight to safety into the USD needed to be unwound in late March once the Fed launched their “Whatever it takes program” which included swap lines. 2) the Fed was printing too many USD...diluting the “global stock” of USD...effectively debasing the currency...which would mean the long elusive inflation genie was about to appear. 3) The virus was spreading in the USA (faster than elsewhere) due to political mismanagement causing the economic recovery to sputter which meant more fiscal and monetary stimulus would be forthcoming which would further dilute the USD’s value. 4) The USD interest rate premium was gone...taking away a key competitive advantage. 5) The US political (and social) scene was becoming increasingly dysfunctional...so get out of USD. 6) Momentum. Once the USD began to fall the decline fed on itself and FOMO kicked in.
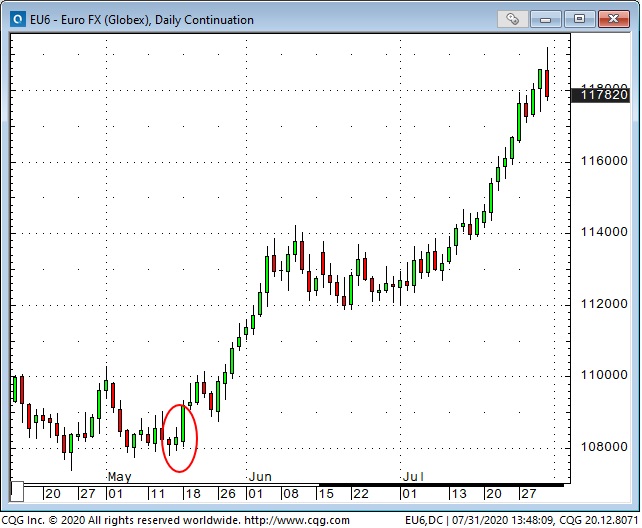
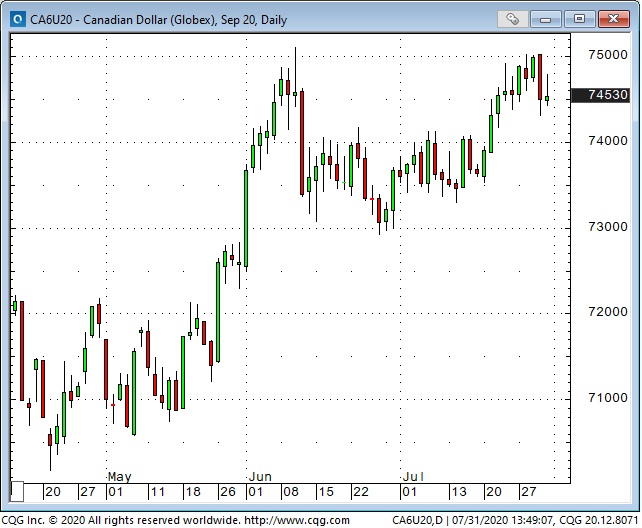
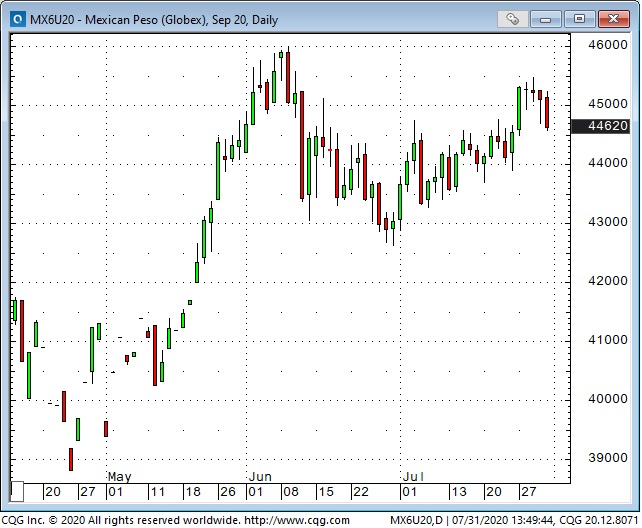
We think aggressive selling of the USD has been one expression of “risk-on” market psychology and is way overdone. In our short term trading accounts we’re short initial small positions of CAD and MEX. These currencies rallied as USD fell but their advance was not nearly as strong as Euro or Swissy or Aussie. We chose to short CAD and MEX because they were the weaker currencies...perhaps more likely to fall if USD rallied.
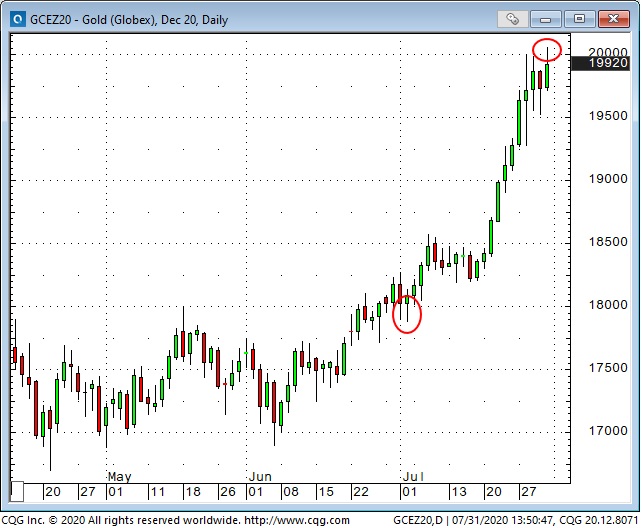
Gold rallied ~$200 in July to hit All-Time Highs this week with the December futures contract trading briefly above $2000. The weak USD helped fuel gold’s rally as did the continuing decline in US real interest rates. (The real yield on the 10-year UST touched negative 1% Friday.) There have been record inflows into gold the past 6 weeks with global gold ETFs at record highs. While some traditional gold buyers have backed away from the market “investment demand” has been the major driver of the rally. We think the explosive rally in gold is ripe for a correction. We’ve taken a limited risk bearish position with an October put spread.
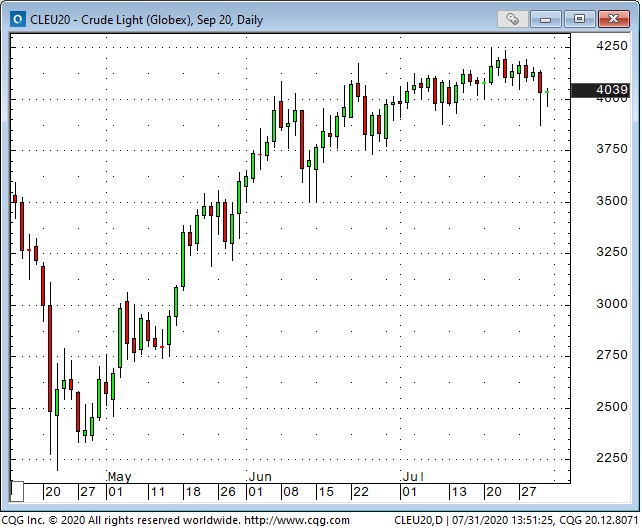
Crude oil has traded in a relatively narrow range the past 6 weeks. We think lack-of-demand is the big story in crude (gasoline is struggling) and we are positioning for lower prices with a bearish time spread (long deferred contracts/short nearby.)
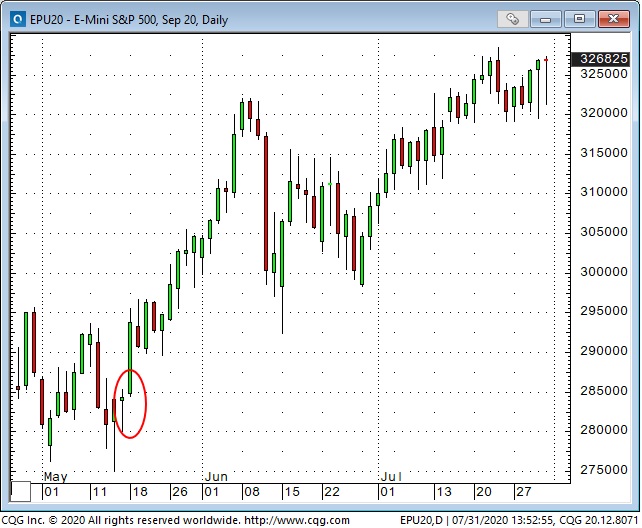
We’ve been shorting the major US stock indices on and off since early June thinking that the rally off the March lows was a bear market rally. We’ve had some profitable trades but on balance we’ve lost money on that idea and therefore have kept our size small and our stops close. We re-established a small short position in the S&P 500 Friday when the index opened weaker despite very bullish earnings reports Thursday afternoon. We will be stopped if the spuz rallies above Thursday’s high.
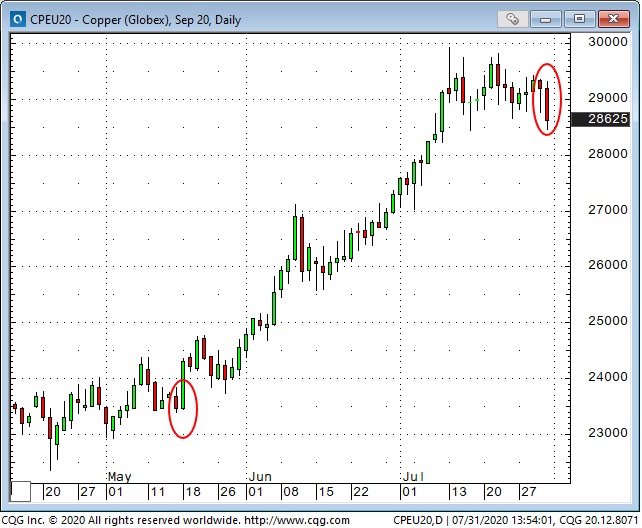
Copper has played into our idea that the “risk-on” rally across markets was getting tired and we might see some meaningful reversals across markets.
