
Markets were anticipating a robust US May employment report – but they didn’t get it
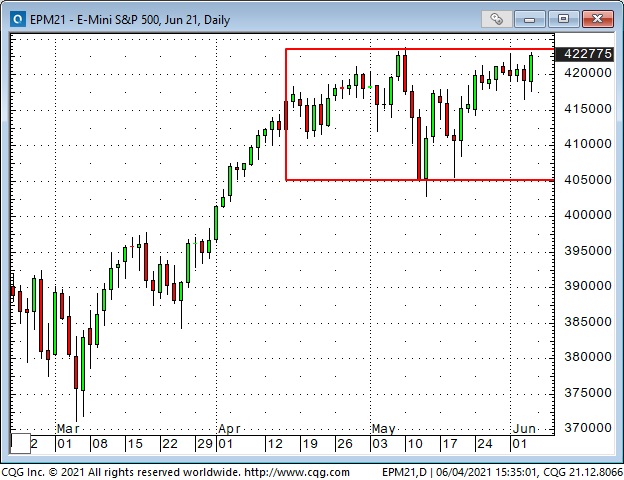
The major stock indices had a huge rally from March 2020 to May 2021 (the S&P rose ~90%), but the indices seemed to lose their upside momentum and drifted sideways for the last six weeks. Given that a big part of that huge rally was driven by monetary and fiscal largess, the recent “sideways drift” may have been due to worries that rising inflation expectations would prompt the Fed to start thinking about taking away the punch bowl.
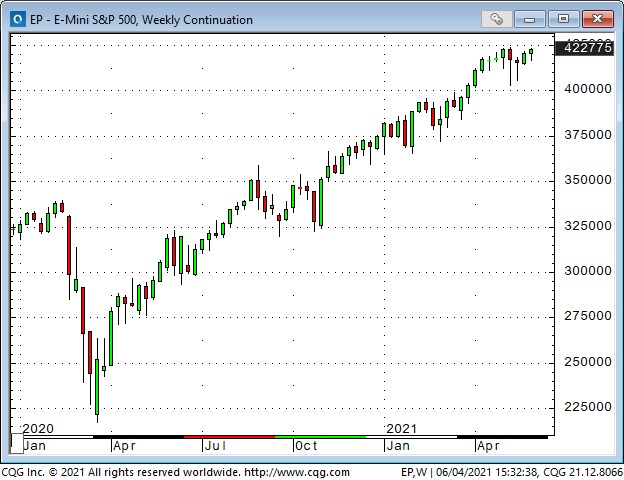
The weaker-than-expected May employment report put an end to worries about the punch bowl being taken away. As a result, the S+P closed Friday at the highs of the last six-week range.
The 10-year Treasury future had it’s best close since early March – obviously not fretting about inflation!

The US Dollar Index, which looked like it was turning higher on Thursday, was slammed back down on Friday.

Gold, which has had a near-perfect negative correlation with the US Dollar this year, jumped after Thursday’s hard break. (US Dollar down, gold up!)

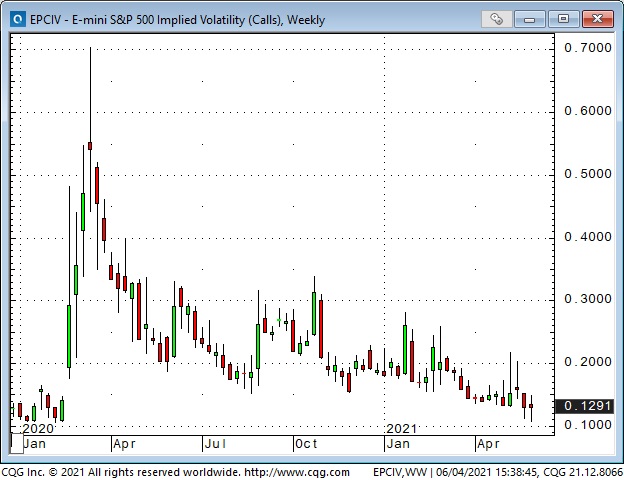
Implied volatility across assets has been low the past several weeks – the IV on the S+P futures closed this week at a 14-month low. Complacency?
The CRB commodity index closed at a new 6-year high.

WTI crude oil came within a whisker of $70 BBL – up 100% from November 2020.

The Canadian dollar, like the S+P, had a huge rally from March 2020 to May 2021 (it rose from 68 to 83 cents), but it seemed to lose momentum the last six weeks and drifted sideways.
Futures market speculators have built their largest net long position in the CAD in three years (ex one week in November 2019.) Their bullish positioning is a play on the commodity rally and is also a barometer of the strong pro-risk sentiment across assets.

My short term trading
I bought OTM puts on both the CAD and the AUD two weeks ago, thinking that both the bullish enthusiasm for commodities and the negative sentiment on the USD were due for a reversal. (Both currencies also had toppy-looking charts – I wasn’t simply taking a shot at top-picking a run-away bull market!)
On Thursday, ahead of the May US employment report, both of these currencies (especially the AUD) were starting to break support levels – my puts were looking good! However, Friday’s reversal on the UE data took my positions back underwater. If there is no downside follow-through to these currencies next week, I’ll throw in the towel, but if the markets roll over, I’ll try to add to my positions.

On my radar
Option VOL is historically low across asset classes – I take that as a sign of complacency with current price levels. The pro-risk sentiment is strong. The re-opening/reflation trade is crowded. Chances are the stock indices print new All-Time Highs next week. What could go wrong?

I’ll be watching for signs that current bullish assumptions are being challenged. I’ll be patient.
One last thing:
I started this blog a year ago. I now have 1,000 subscribers and 4,000 regular viewers ( Lots of folks don’t like to give up their email address – I get it – but I don’t share addresses with anybody, except Mailchimp – they sent out the alerts when I write a new post. )
From day one, I wanted this blog to be a “work in progress,” and I’ve changed the style and content from time to time. So if you have a minute, please hit the Contact link at the top of the page and tell me if there is something different you’d like to see – tell me how you use this blog. Much appreciated, cheers!