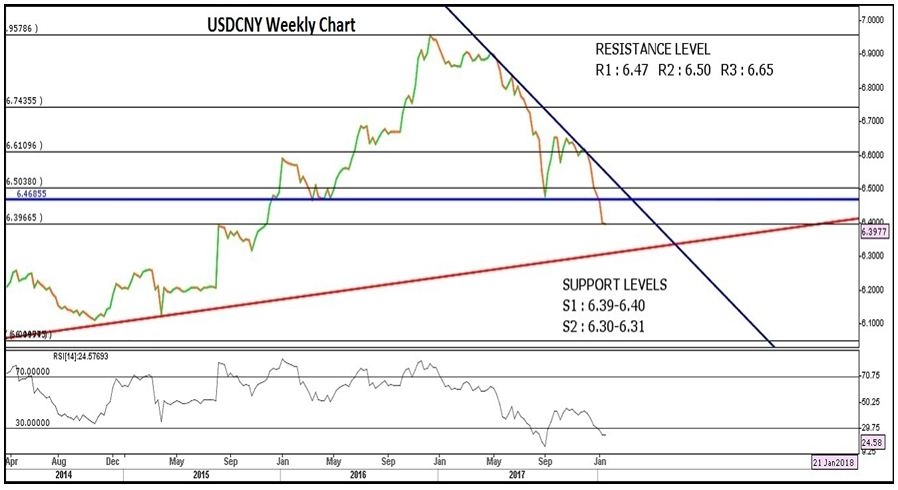
On a year to date basis, the Chinese Yuan has appreciated by almost 8% against the US dollar. The Yuan’s robust performance was the result of a weaker dollar, sound economic fundamentals and improved regulation of capital flows and increased global use of the currency. The US dollar index has weakened by almost 11% in the year 2017.
The strengthening of the Yuan was backed by:
Stronger Economic Scenario
The world's second-largest economy posted broadly strong data for 2017 on the back of a broad global recovery. The pace of the economic growth has accelerated for the first time in seven years as exports, consumer spending and construction activities strengthened.
The Chinese economy grew 6.9%, ending the year 2017 on a positive note as official figures topped the government target of around 6.5% and will keep the economic forecast around 6.5% in 2018 as well. In the meantime, China's exports grew by nearly 11% from 2016, while the combined value of imports and exports rose by 14.2% and the trade surplus was recorded at more than 2.87 trillion yuan — around $447 billion, a decline from 2016.
China's forex reserves ended the downward trajectory of the previous two years to gain 129.4 billion U.S. dollars in 2017, while its current account surplus remained in a reasonable range and the financial account saw net capital inflow in the first three quarters of last year. However, while the global growth will provide some backing for China’s exports, the economy might face some hardships.
Risks to the Chinese Economy in 2018
As we head into 2018, the fed’s monetary policy and geopolitical risks pose uncertainties to the global economy, from which China's economy will not be excluded.
U.S. President Donald Trump has repeatedly signaled tougher action on what he calls unfair practices that have led to a massive trade deficit with China. The Chinese economy is also vulnerable to the rise in the US tax rates as an increase in rates would likely cause capital outflow from China and put pressure on the Chinese Yuan. If this scenario prevails, the PBOC might tighten the liquidity which in turn would raise further concerns about the growth outlook.
The risk of housing price bubbles is the top financial risk that regulators are monitoring.
The overall sentiment towards the economy is more or less pessimistic as the fear grows, surrounding the rising Debt-to-GDP ratio and a sudden collapse of the economy due to strong adverse shocks.
The world's second-largest economy still has to tame debt risks and factory pollution, but strong growth gives the government the room it needs to tackle such issues.
The future path
China’s economic growth in 2018 may slow down. For investors, they will need more leading indicators to better evaluate how well China is solving domestic issues and developing new momentums. The economy should balance growth and financial risk prevention. A poor growth performance will worsen financial stability and vice versa. In the longer-run, China can benefit from government-promoted innovation as well as recent structural reforms. Much of the focus will also be on “New China” which is driven by technological innovation.
Meanwhile, the monetary policy is widely expected to be neutral and cautious in the year 2018. The reason being, the central bank is facing a dilemma between loosening policy to stimulate the economy and tightening it to curb financial risks. Due to such a scenario, the PBOC is unlikely to cut interest rates and is expected to make a fundamental change in policy. This will depend on progress in controlling financial risks.
As China moves ahead to deepen and open its financial markets, its push to rebalance its economy will, however, require a gradual approach to liberalizing its capital markets and increasing its capital account convertibility. In the meantime, investors will be keenly watching the opening-up theme which could bring negative as well as positive impacts on China. Besides, as the Chinese market becomes accessible to overseas investors, it will generate new growth momentum for the economy and attract capital inflows.
Technically
Support Levels:
- We can see major support near $6.39 - 6.40 levels which is 38.00% of Fibonacci retracement levels. The USD/CNY pair is not expected to breach this levels in the near term.
- However, if the above-said levels are breached, the next major support near 6.30-6.31 levels from trend line 2014 lows. (Redline)
Resistance levels:
- Next resistance levels would be $6.47: Horizontal Trend line
- $6.50, 50% Fibonacci retracement
- Weekly RSI is below 30 levels; being an oversold level, we can see some bounce back from this level.
We recognize that if the pair starts trading above $6.50 level, it will give a breakout of trend line (Dark blue line) and will eye for $6.65-6.75.
However, if the USD/CNY pair fails to sustain itself above $6.39-40 levels, it would drift towards $6.30 levels. We are not expecting the pair to break and trade below $6.30 levels in 2018.

