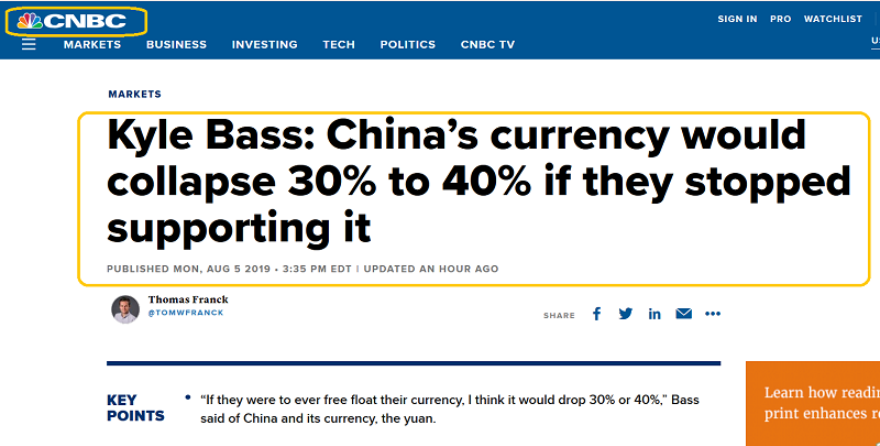
Is China a currency manipulator? My view is almost identical to Kyle’s; China’s government is manipulating its currency… higher!
Trump’s tariff tax obsession may be somewhat comical, but it is creating substantial weakness in China’s currency. That’s because foreign and domestic investors are moving significant amounts money out of Chinese risk markets and into dollar-denominated safe havens like T-bonds, gold, and the yen.
Kyle believes the yuan would fall from 7 yuan per dollar to about 10 per dollar if China stopped supporting the yuan. I believe it would fall much more than that if China really attempted to manipulate the yuan lower!
In a full trade war, America would likely get financially obliterated by China.
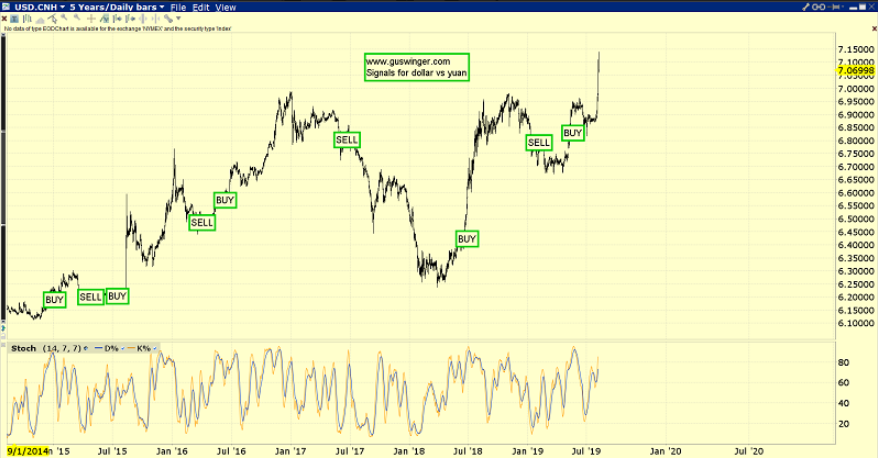
I’ve highlighted my guswinger.com signals for the dollar versus the yuan on this daily chart.
My main swing trade focus is NUGT/DUST and TQQQ/SQQQ. We were long NUGT and SQQQ going into Monday’s “Day of Mayhem” and booked solid profits.
Having said that, I do trade FOREX as well, and the 7.00 resistance zone for the dollar versus the yuan could become support soon, especially if Trump bombs global markets with more of his silly tariff taxes.
His actions are destructive for stock markets… and fabulous news for gold!
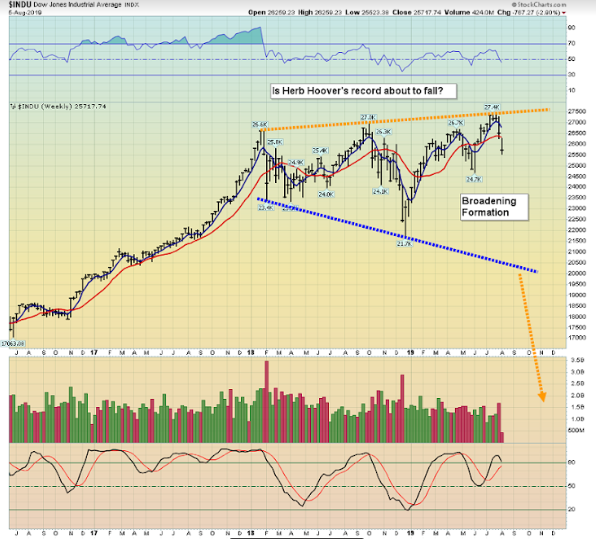
This is the horrifying weekly Dow chart.
Not only is a Dow Theory sell signal likely imminent, but there’s a gargantuan broadening top pattern in play!
In 1929 a daily chart broadening top appeared. As the market crashed Herb Hoover launched a tariff tax “carpet bombing” on US stock market investors.
That helped the Dow fall a record 90% from its highs, but as this US business cycle peaks I think President Trump could possibly break Hoover’s record and pound the Dow more than 90% lower with more of his tariff taxes.
The technical target of the broadening top pattern is about 14,000. Maybe Trump takes Hoover’s record and maybe he doesn’t. Regardless, the future for the US stock market looks dismal.
Ironically, the market could be saved by Trump’s obsession with QE and low rates. If inflation appears, and heavyweight players like Ray Dalio predict that it will, Trump could strongarm the central bank into not raising rates. Volker raised rates aggressively in the late 1970s when faced with stagflation.
If stagflation appears in the next few months and Trump strongarms the Fed into not raising rates, that would open the door to a full hyperinflationary event. The stock market could rise like the Zimbabwe stock market did during its hyperinflation.
Terrorist events like the Dayton and El Paso attacks could become more frequent if Trump continues to refuse to cut income taxes for the working class. The working class is not directly invested in the stock market in a material way and wage growth has been weak (and arguably abysmal).
Debt levels are high. Tempers are starting to flare. Blue collar America can’t sustain the economic expansion with credit card rates that are cut to 19% from 20%. They are in desperate need of an income tax cut and it’s just not happening. All they are getting from their government are ridiculous stories about the supposed greatness of stagflationary tariff taxes, more government debt, and more government spending.
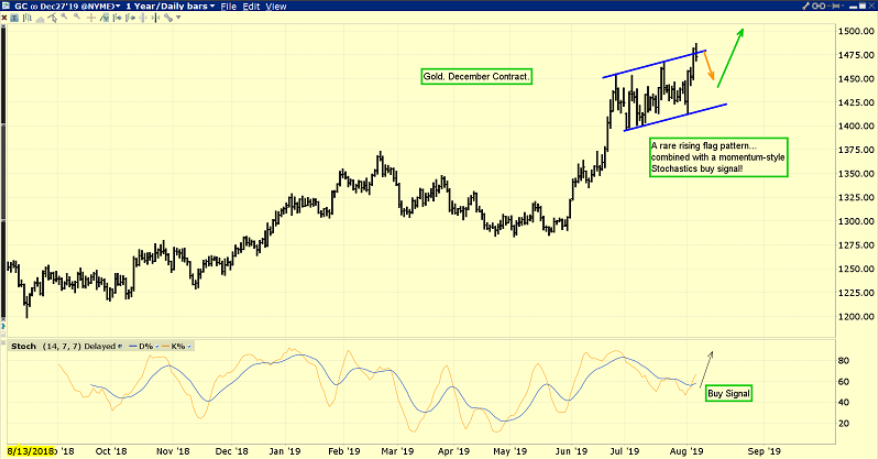
With these events in play, it’s obvious why institutional interest in gold is growing. This is the daily gold chart. There’s a rare rising bull flag pattern in play.
Gold is near weekly chart resistance at $1480-$1520. If Trump throws in the white towel on his tariff taxes, gold is likely to have a significant pullback from this price zone. I don’t believe he’ll do that, so the door is now open for a surge towards $1560.
An “overshoot” towards $1650-$1700 is possible if more tariffs are launched during the September-October stock market “crash season”. The Dow would probably fall towards 20,000 in that situation.
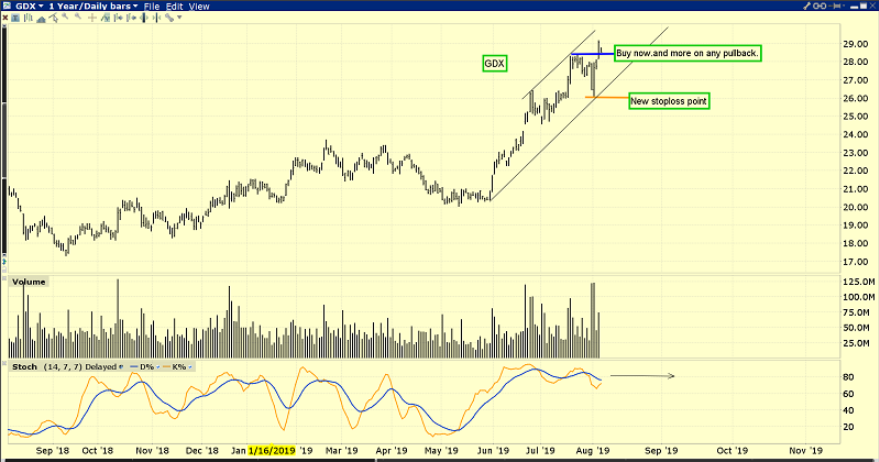
This is the superb GDX (NYSE:GDX) chart. GDX generated a fresh buy signal yesterday by taking out its recent minor trend high. Stoploss enthusiasts could use either $27.50 or $26 for a stop.
Investors who are missing out on the rally should just buy a small position now or use my swing trade service to manage risk.
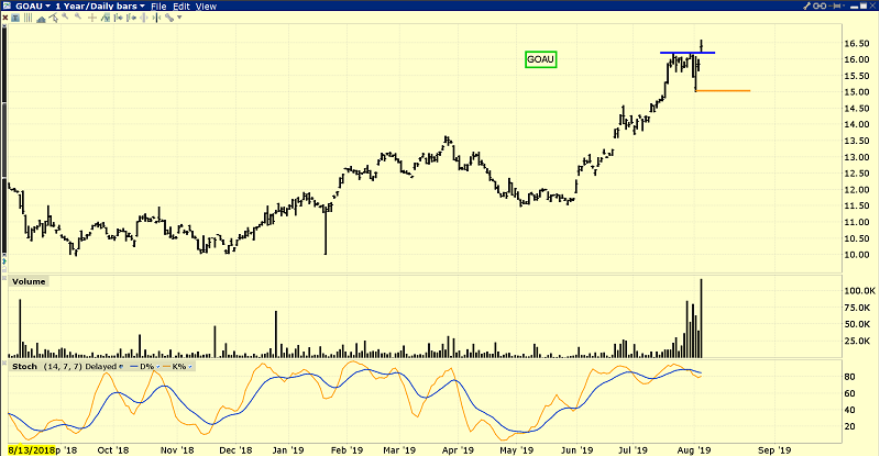
This is the GOAU chart. The U.S. Global GO GOLD and Precious Metal Miners ETF (NYSE:GOAU) is lower priced than GDX or VanEck Vectors Junior Gold Miners (NYSE:GDXJ). It holds some solid royalty companies. Investors who are missing out on the gold stock “super surge” should buy some GOAU.
For investors buying with significant size, a stoploss could be placed at $14.90 to manage risk. It’s generally easier to take a position in something new than something an investor already owns. For a lot of investors, GOAU is likely a good play. The entire $16-$15 area is a good buying area. I expect the next blast of tariff taxes will send it soaring to my $20 target, for a solid 25% capital gain!
Written between 4am-7am. 5-6 issues per week. Emailed at aprox 9am daily.
Stewart Thomson is a retired Merrill Lynch broker. Stewart writes the Graceland Updates daily between 4am-7am. They are sent out around 8am-9am. The newsletter is attractively priced and the format is a unique numbered point form. Giving clarity of each point and saving valuable reading time.
