
Summary:
- The S&P 500 (SPX) sank 65 points last week to 2881, a decline of 2.2%.
- The selloff was sparked by a Sunday Trump tweet that refreshed his trade war with China.
- Our projection is for the S&P 500 to chop widely between support and resistance before resuming the trend lower.
The stock market moved sharply lower after the previous week’s buying binge proved to be a final hook for the bulls.
On Friday, President Trump in dramatic fashion increased the tariffs on $200 billion worth of Chinese imports from 10% to 25%. Playing it cool, he tweeted, "Talks with China continue in a very congenial manner - there is absolutely no need to rush.”
The next move is with China, who has already imposed tariffs on $110 of $120 billion of US imports. They have now threatened to retaliate and increase those tariffs.
Beyond this, the Trump administration sent an aircraft carrier and bomber squadron to multiple locations in the middle east to address an unspecified Iranian threat. The administration also warned American commercial ships of the risk of attack by Iran.
Further east, North Korea resumed testing on several short-range missiles, which according to state media, was overseen by Kim Jong-un himself. This occurred as the US and South Korea launched joint military exercises that apparently bothered North Korean officials.
The return of these geopolitical tensions occurred amidst a mildly bullish global macro picture. US job openings for March came in at 7.48 million versus an expectation of 7.35 million, and UK manufacturing production came to 0.9% growth for March, compared to 0.2% expected.
Finally, with earnings season now 90% complete, 3/4 of companies beat expectations, even as profit decreased by an average of 4%, according to FactSet. This is due of course to companies lowering profit estimates, which continued as firms issued Q2 negative guidance by a ratio of 4:1.
S&P 500 (SPX) Daily Chart
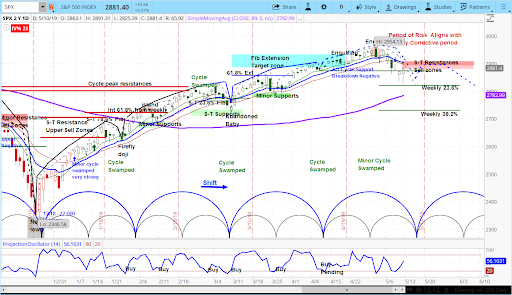
Our approach to technical analysis uses market cycles to project price action. Our analysis for the S&P 500 is wide and choppy price action, moving between support at 2820 and the resistance zone between 2878-2907. Risks pick up again later in May, with a likely resumption to the downside of the present correction.