Get 40% Off
⚠ Earnings Alert! Which stocks are poised to surge?
See the stocks on our ProPicks radar. These strategies gained 19.7% year-to-date.
Unlock full list

Trade War Battles Escalate As The Alligator Bites

Published 08/06/2019, 08:20 AM
Updated 07/09/2023, 06:31 AM

My post of July 14 discussed the trade war between China and the U.S. and the effects it was having on China, in particular. Since that date, I added several important updates on that post, which are definitely worth reading...the latest one was earlier Monday.

The following World Stock Markets heat map shows the major losses incurred by world markets at their respective closes today...not a pretty picture.
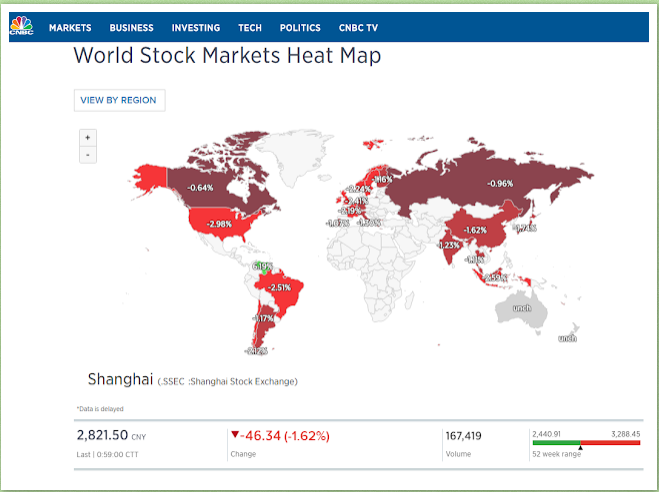
World Stock Market Heat Map

Volatility has ramped up significantly since July 26 and price closed on the following SPX:VIX monthly ratio chart well below the 150 Bull/Bear Line-in-the-Sand level at 115.69.

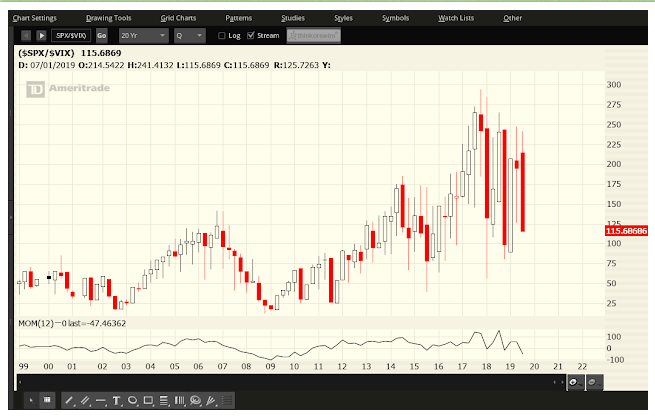
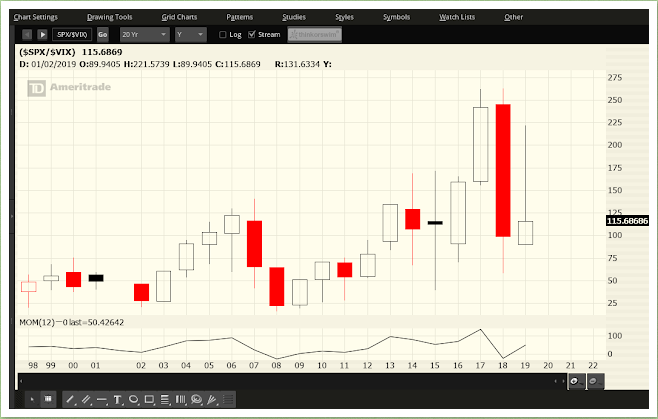
Price action on this ratio peaked in January 2018 and it has made a series of lower highs, which are clearly evident on the next three charts (depicting monthly, quarterly and yearly timeframes, respectively)...indicating that the successive rallies in the SPX were getting weaker.

A drop and hold below 100 on this ratio could produce an acceleration of the selloff, sending the SPX down to, at least 2600, or even 2400, as I described in one of my updates in the above-mentioned post.
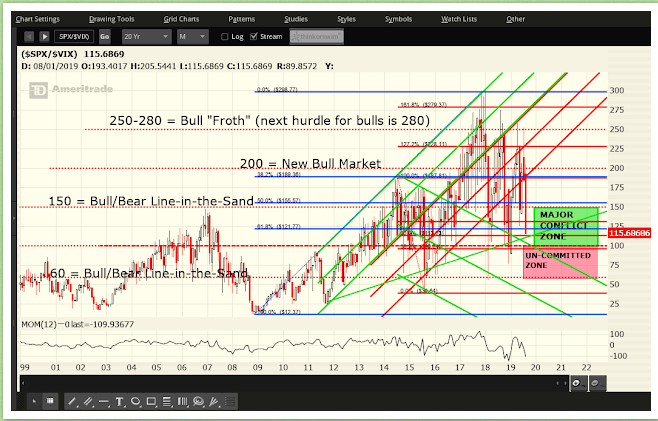
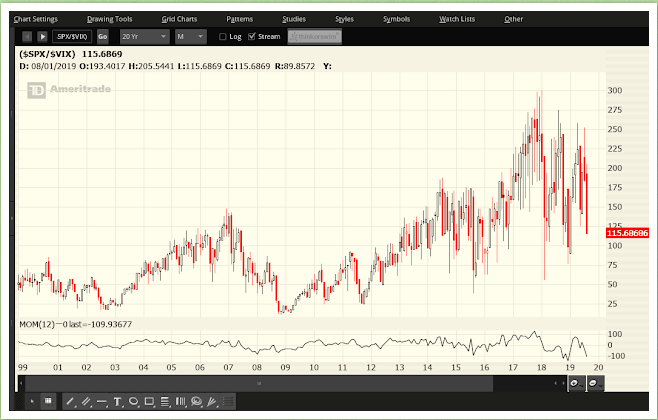
SPX:VIX Monthly
SPX:VIX Monthly Chart
SPX:VIX Quarterly
SPX:VIX Yearly

A drop to 2600 would land price on the median of this long-term uptrending regression channel (after nearly tagging a target price of 3047 identified in my post of late June), as shown on the following SPX monthly chart.
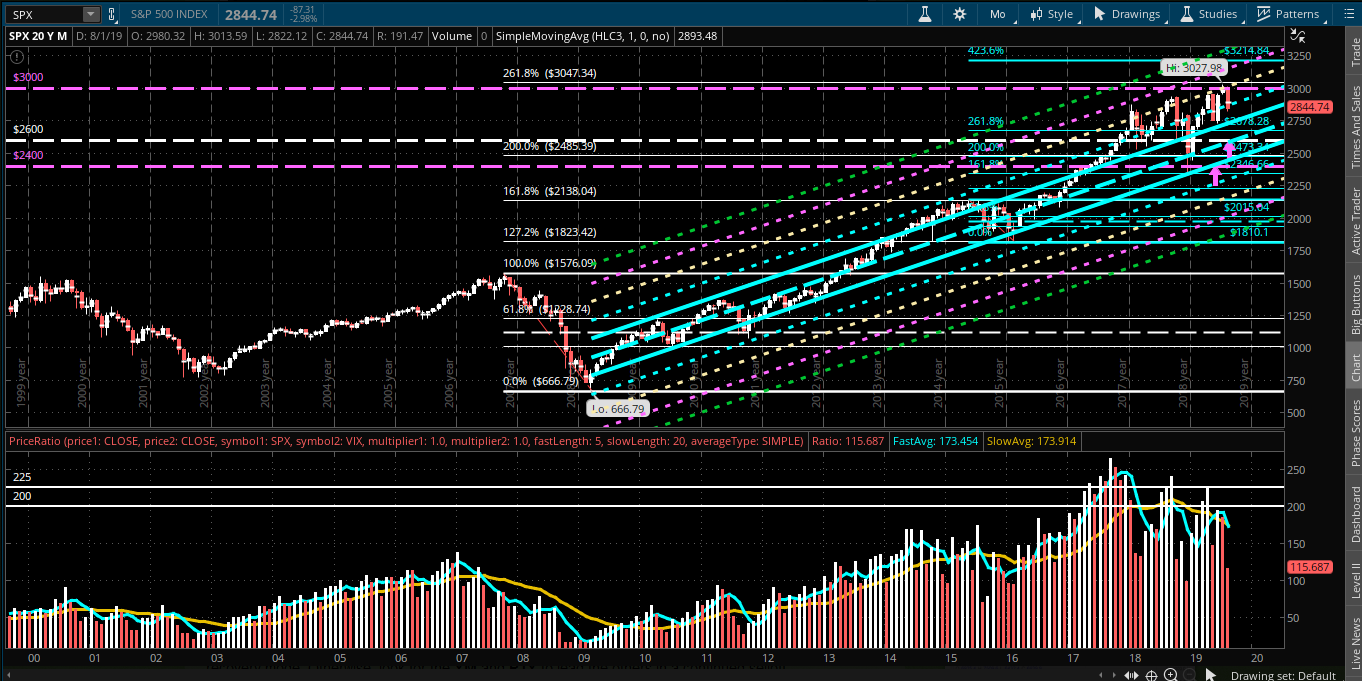
SPX Monthly 20Y Chart

And, as I warned in my aforementioned post of June 29, the alligator formations on the YM, ES, NQ and RTY E-mini Futures Indices have now crossed, hinting of further weakness ahead.

Of note, is price relative to the 200-day MA (yellow). If we see an acceleration of selling to take the ES and NQ below it, I'd say that the SPX has a good chance of hitting 2600, or lower...watch for price to drop and hold below 100 on the SPX:VIX ratio for confirmation. Inasmuch as the YM and RTY are already below their 200 MA, we'll see if they can catch a sustainable bounce anytime soon to lead the other two back into recovery mode. Otherwise, look for the YM and RTY to lead the others in a continued selloff.
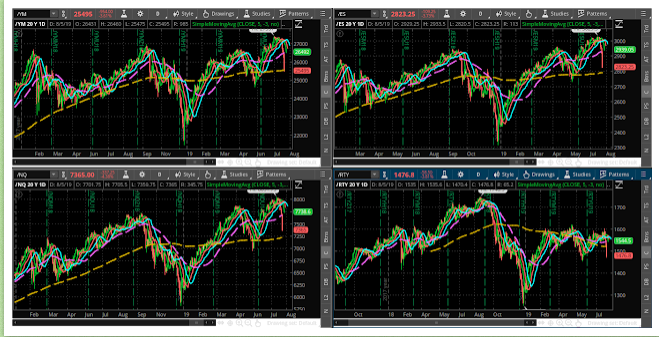
Futures Charts

Latest comments

thanks for the nice article
You're welcome, Mike. . . . One thing to note, however, is that the link to the first article that I referenced in paragraph one has been linked to the wrong post (by Investing.com editorial staff)...the correct one can be found on my Blog here: https://www.strawberryblondesmarketsummary.com/2019/07/market-battle-fatigue-china-versus-usa.html. . . I have alerted their editor to their error, but they have yet to correct it (as of 11:30 pm ET Aug. 11).
  Thanks Candy, I’ve been reading all of your articles since last year.  Your predictions have been very accurate.  I sold my stocks a couple of weeks ago and plan to re enter around your price targets.  I will conitinue to read and enjoy your articles.  Thanks and cheers
Risk Disclosure: Trading in financial instruments and/or cryptocurrencies involves high risks including the risk of losing some, or all, of your investment amount, and may not be suitable for all investors. Prices of cryptocurrencies are extremely volatile and may be affected by external factors such as financial, regulatory or political events. Trading on margin increases the financial risks.
Before deciding to trade in financial instrument or cryptocurrencies you should be fully informed of the risks and costs associated with trading the financial markets, carefully consider your investment objectives, level of experience, and risk appetite, and seek professional advice where needed.
Fusion Media would like to remind you that the data contained in this website is not necessarily real-time nor accurate. The data and prices on the website are not necessarily provided by any market or exchange, but may be provided by market makers, and so prices may not be accurate and may differ from the actual price at any given market, meaning prices are indicative and not appropriate for trading purposes. Fusion Media and any provider of the data contained in this website will not accept liability for any loss or damage as a result of your trading, or your reliance on the information contained within this website.
It is prohibited to use, store, reproduce, display, modify, transmit or distribute the data contained in this website without the explicit prior written permission of Fusion Media and/or the data provider. All intellectual property rights are reserved by the providers and/or the exchange providing the data contained in this website.
Fusion Media may be compensated by the advertisers that appear on the website, based on your interaction with the advertisements or advertisers.
© 2007-2024 - Fusion Media Limited. All Rights Reserved.