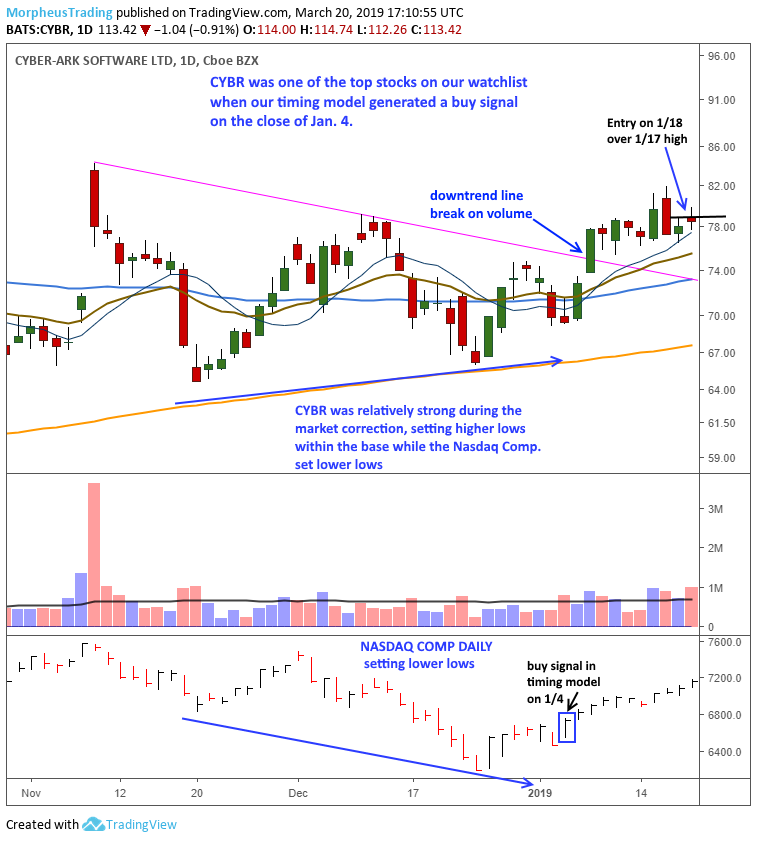
Earlier this year, we captured an explosive move in $CYBR in our nightly swing and position trading newsletter The Wagner Daily.
Why We Believed $CYBR Was Ready To Explode Higher
The daily chart of $Cyberark Software Ltd (NASDAQ:CYBR) first caught our attention in early January by setting higher lows within a basing pattern during a market correction when all broad market indices were setting lower lows. At that time, most small and midcap growth stocks had corrected 40-50% off highs but $CYBR pulled back less than 25% (sign of strength).
The daily chart was impressive, but what really sold us on the trade was the monthly chart, where the price was chopping around in a tight range for a few months just below all time highs. A breakout from the current base would lead to a new all-time high with no resistance above!
Along with the strong technical action we discussed above, $CYBR produced two quarters in a row of impressive earnings and sales growth at +71% and +92% (eps) and +35% and +31% (sales).
How We Entered

On the close of January 4, our market timing model went on a buy signal, alerting us to begin to put money to work on the long side. A few days later on 1/9/19, $CYBR cleared the downtrend line of the consolidation on a pick up in volume, which was a buy signal. We patiently waited for a low risk entry point to emerge on a pullback, but the price action just chopped around in a tight range, allowing the 10-day moving average to catch up. On the night of 1/17, we alerted subscribers of The Wagner Daily that we were placing a buy stop over the 1/17 high after the price touched the rising 10-day MA. The buy stop triggered the following day.
When To Take Profits
When to exit a winner is a very personal question, as it depends on the time frame of the trader. Shorter term swing traders can sell $CYBR into strength when it’s up 10-20%. We prefer to hold stocks for 20-30% gains or more, if possible, depending on the strength of the trend.
Our first exit in $CYBR was simply a sell into strength to take some profits off the table. We sold 20% of our position for a 44% gain.
On April 4, $CYBR sold off below the 20-day EMA before closing back above on a pick up in volume. To guard against a breakdown below the 20-day EMA, we raised our stop beneath the low of April 4 on 40% of the original position, which triggered on April 8 for a 42% gain.
Our final exit was on April 17, as we sold the remaining 40% for a 52% gain due to a bearish engulfing candle that printed after a failed move to new highs.
Our sells above are not perfect. However, using the 20-day EMA as a guide during the first few weeks in the position allowed us to hold on long enough to capture a 47% gain, which is pretty good! The one sell we’d like to have back was the second exit on April 8, as we were shaken out of strong position on a slight dip below the 20-day EMA. We should have been more patient with the action since the price failed to violate the 20-day EMA on a closing basis.
The important take from the chart above is that big winners tend to take care of themselves.
