Get 40% Off
⚠ Earnings Alert! Which stocks are poised to surge?
See the stocks on our ProPicks radar. These strategies gained 19.7% year-to-date.
Unlock full list

Tough Week For World Equities

Published 11/15/2015, 12:15 AM
Updated 07/09/2023, 06:31 AM

New 52 week lows are once again dominating US market breadth
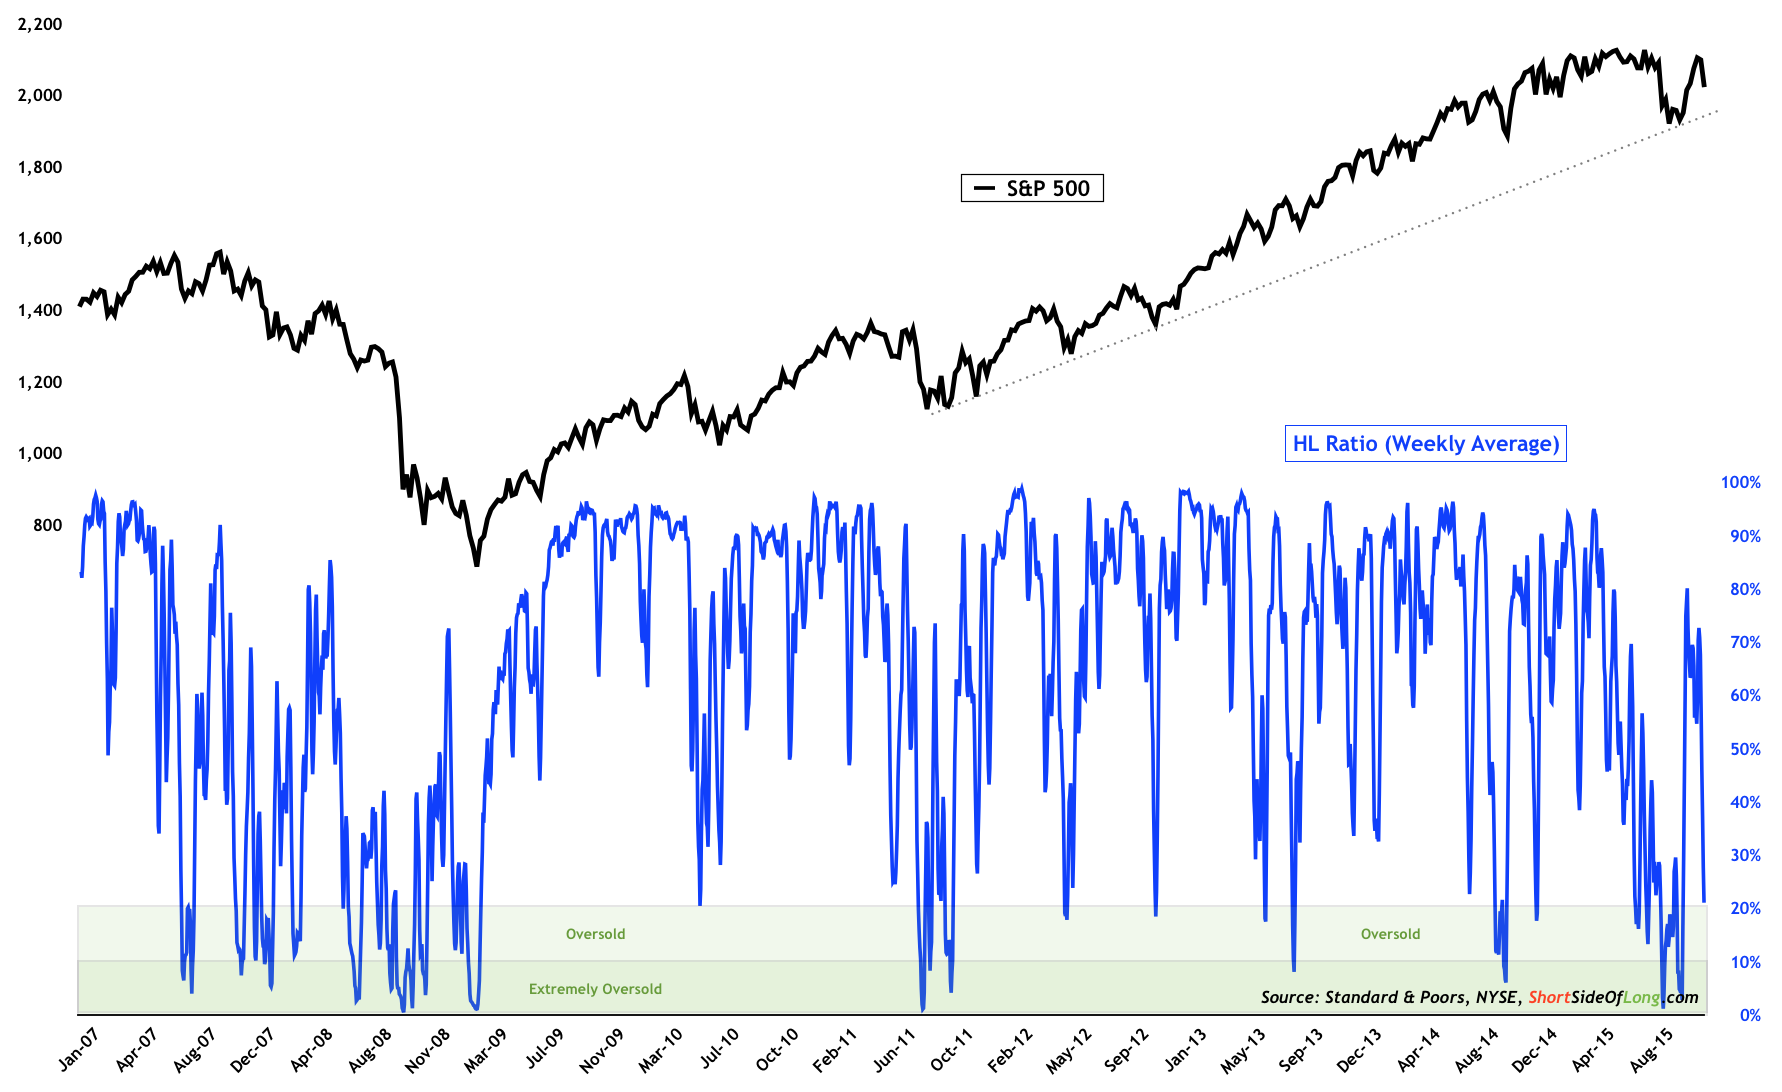
SPX vs HL Ratio 2007-2015Source: Short Side of Long

Last week was yet another tough week for financial assets, including equities. Global stocks (iShares MSCI ACWI (O:ACWI)) declined 3.4% while US equities (SPDR S&P 500 (N:SPY)) also fell for the first week in many by 3.6%.

Emerging Market equities (iShares MSCI Emerging Markets (N:EEM)) continued their underperformance by selling off 5.0%, while European equities (SPDR Euro Stoxx 50 (N:FEZ)) lost 3.7%. Volatility jumped 40.1%, the majority of it occurring during the last three days of the week.

From the short term perspective, US stocks are becoming oversold yet again, and we might see a rebound rally at some point in the not so distant future. S&P 500 itself is now down 7 out of the last 8 trading days, so if we see more selling during Monday and/or Tuesday, we could find ourselves with at least a temporary bottom.

On Thursday, the NYSE posted 168 issues reaching 52 week new lows, while on Friday this reading jumped even further to 227. Some of the new lows are occurring in important corporations and sectors such as American Express Company (N:AXP), Anadarko Petroleum Corp (N:APC), ArcelorMittal (N:MT), Archer-Daniels-Midland (N:ADM), Chipotle Mexican Grill (N:CMG), Deutsche Bank (N:DB), Dollar General (N:DG), Gap (N:GPS), IBM (N:IBM), Kohl`s (N:KSS), Macy`s(N:M), Nordstrom Inc (N:JWN), Tiffany (N:TIF), Time (N:TIME), United States Steel (N:X) and Wal-Mart (N:WMT) amongst others.

Furthermore, the percentage ratio of 52 week new highs relative to 52 week new lows stands at 21% vs 79% respectively (refer to chart above). Finally, global stock indices (the most important ones) are all once again trading below their respective 200 day moving averages.

No important global stock market indices above their 200 day MAs
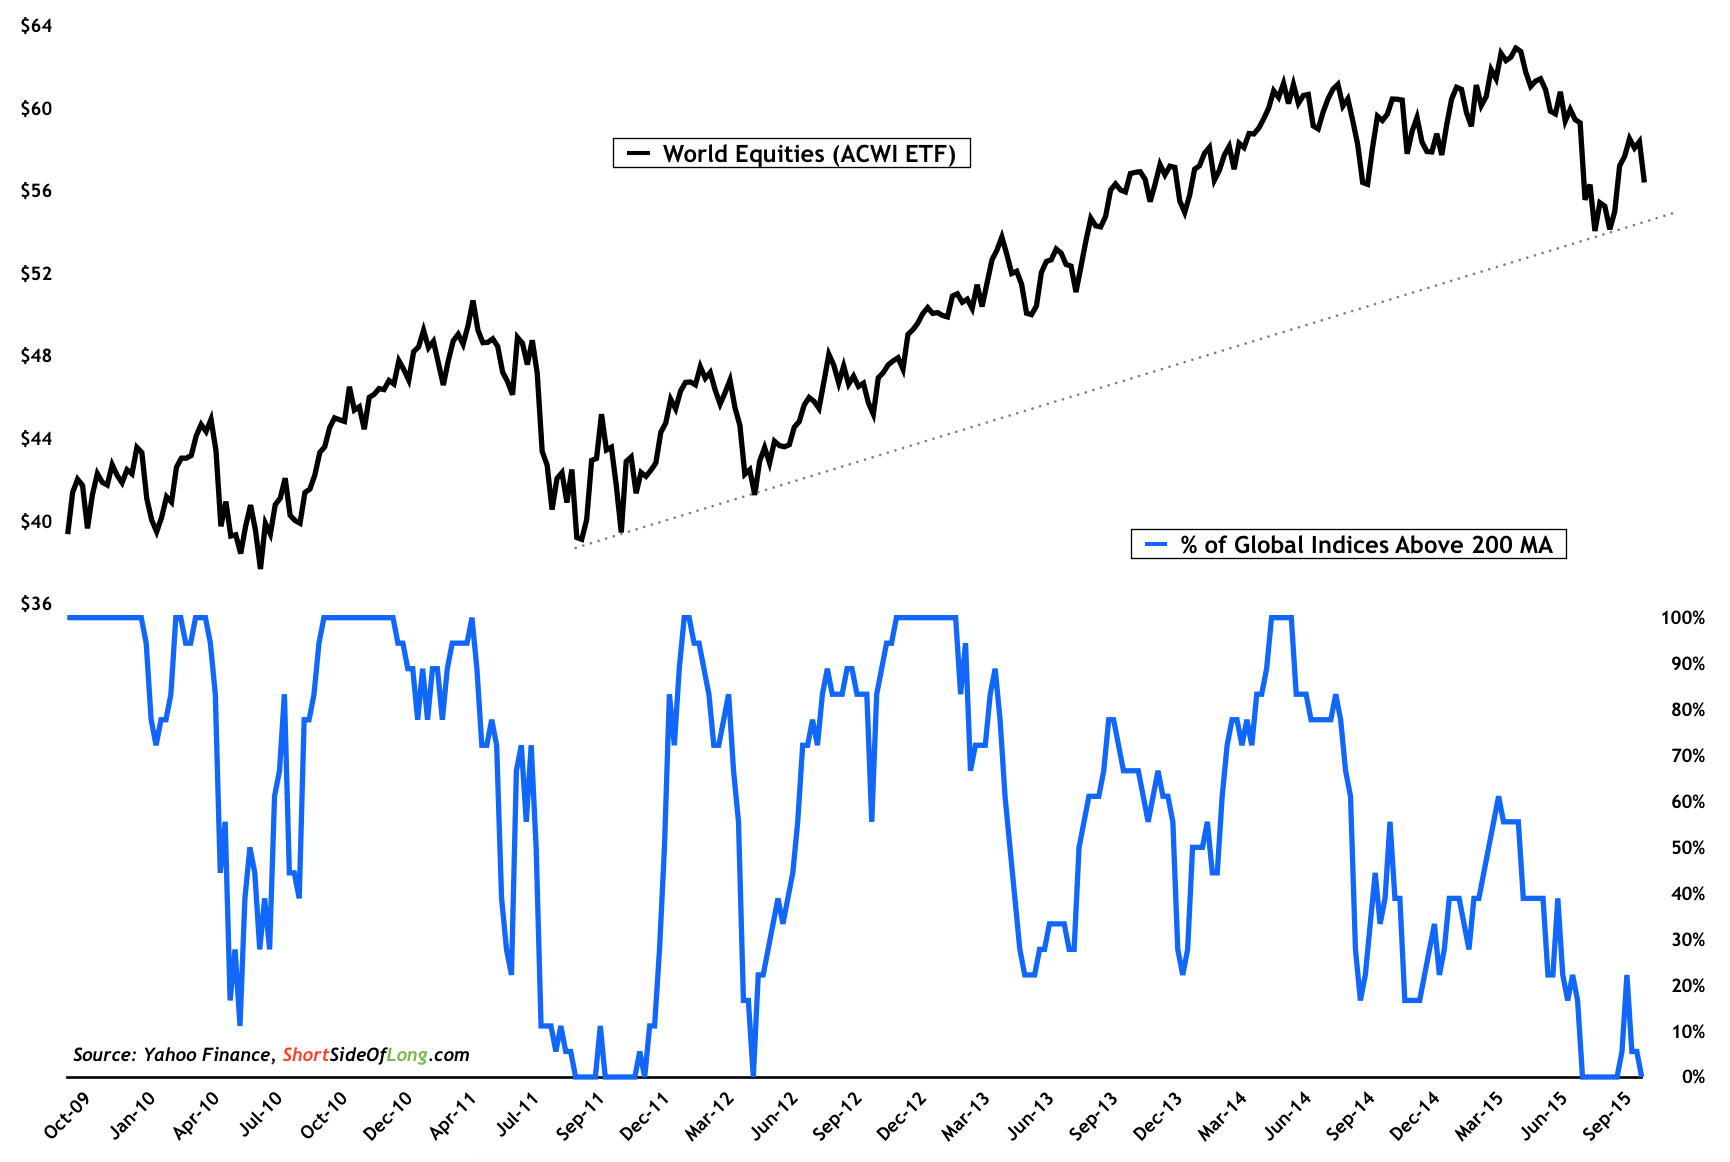
World Equities vs % Global Indices Above 200MA 2009-2015Source: Short Side of Long

Latest comments

Risk Disclosure: Trading in financial instruments and/or cryptocurrencies involves high risks including the risk of losing some, or all, of your investment amount, and may not be suitable for all investors. Prices of cryptocurrencies are extremely volatile and may be affected by external factors such as financial, regulatory or political events. Trading on margin increases the financial risks.
Before deciding to trade in financial instrument or cryptocurrencies you should be fully informed of the risks and costs associated with trading the financial markets, carefully consider your investment objectives, level of experience, and risk appetite, and seek professional advice where needed.
Fusion Media would like to remind you that the data contained in this website is not necessarily real-time nor accurate. The data and prices on the website are not necessarily provided by any market or exchange, but may be provided by market makers, and so prices may not be accurate and may differ from the actual price at any given market, meaning prices are indicative and not appropriate for trading purposes. Fusion Media and any provider of the data contained in this website will not accept liability for any loss or damage as a result of your trading, or your reliance on the information contained within this website.
It is prohibited to use, store, reproduce, display, modify, transmit or distribute the data contained in this website without the explicit prior written permission of Fusion Media and/or the data provider. All intellectual property rights are reserved by the providers and/or the exchange providing the data contained in this website.
Fusion Media may be compensated by the advertisers that appear on the website, based on your interaction with the advertisements or advertisers.
© 2007-2024 - Fusion Media Limited. All Rights Reserved.