Get 40% Off
⚠ Earnings Alert! Which stocks are poised to surge?
See the stocks on our ProPicks radar. These strategies gained 19.7% year-to-date.
Unlock full list

Total Crypto Market Cap Hits New All-Time Highs

Published 01/05/2018, 06:58 AM
Updated 03/21/2024, 07:45 AM

The total market capitalization of all cryptocurrencies made new all-time highs of over $700 Billion. The growth in the overall market cap has been boosted by rises in altcoins as demand for Bitcoin (BTC) has been waning recently. Although the mainstream media continues to report on Bitcoin, there is a power shift following extraordinary price increases by altcoins such as Ripple, Ether, Cardano, Stellar and Tron.

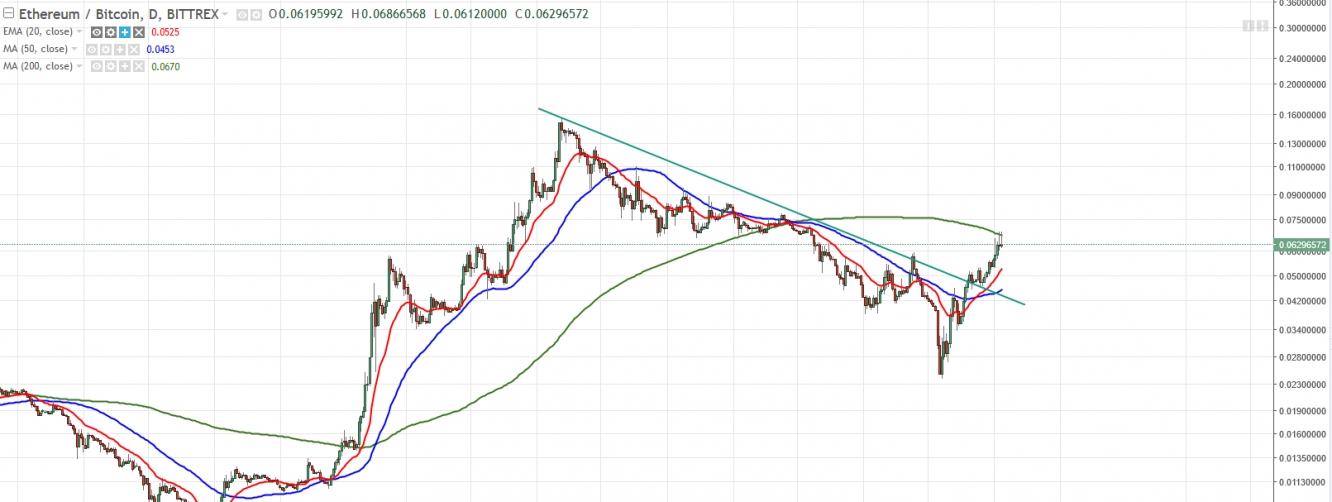
The change in focus to altcoins is demonstrated by the Daily chart of Ethereum against Bitcoin (ETH/BTC). After many months, ETHBTC broke out of a downtrend as ETH is set to outperform BTC over the coming weeks.

ETHBTC Chart

Bitcoin

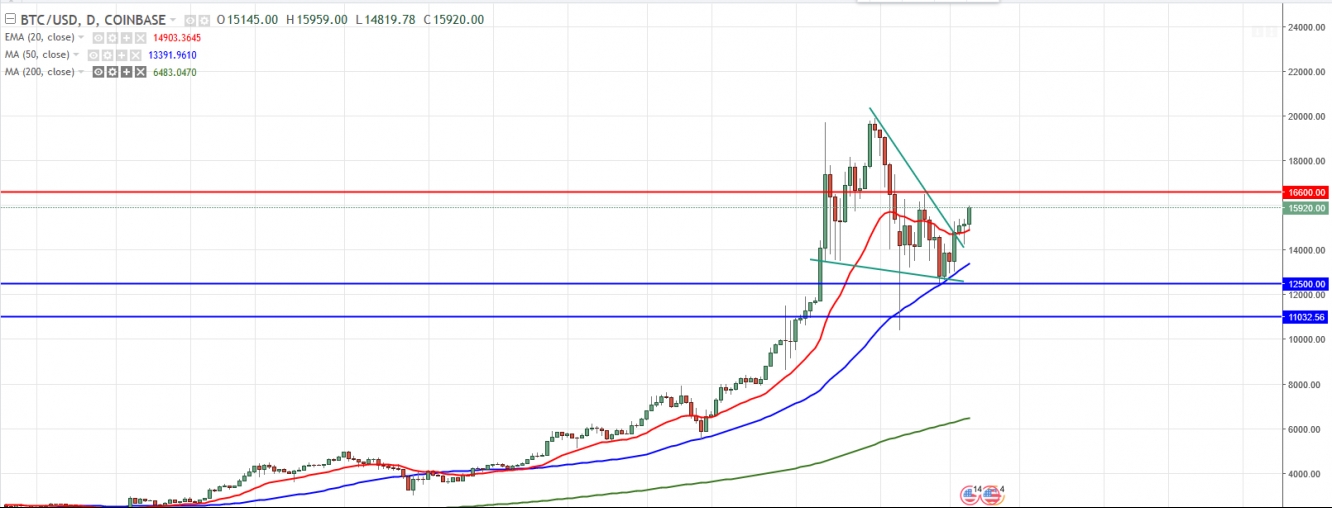
Bitcoin against U.S Dollar (BTC/USD) had a 50% retracement and tested the 10,000 level. However, corrections of this nature are not unusual in the history of this cryptocurrency. The coin got a boost after news that Peter Thiel’s venture capital firm had made substantial investments in BTC, propelling prices back up over the 15,000 handle. This pair is now attempting a breakout of a falling wedge in the Daily time frame. Provided the 12,500 region holds, a move to resistance at 16,600 is possible. A break above this area paves the way to a test of new highs.

BTCUSD Chart

Ripple

One of the most stunning moves has been in Ripple (XRP). The price of XRP is up over 1,000 percent in just the last month alone and with market capitalization above $130 billion; the coin has displaced Ethereum as the second largest cryptocurrency after Bitcoin. The gains come after news that a consortium of some Japanese credit card companies plan to use the technology.

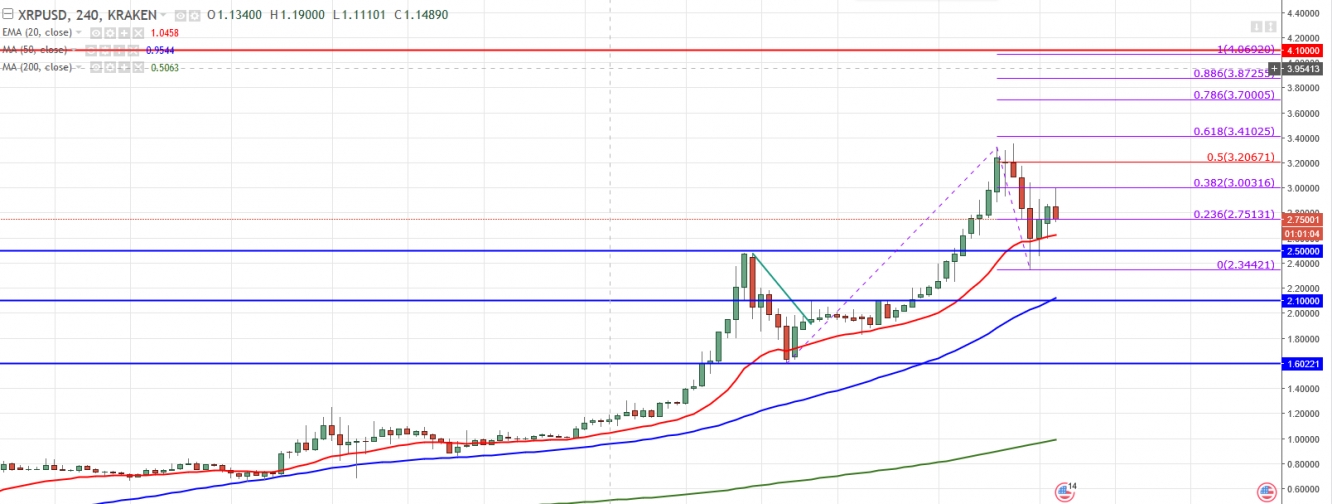
On the 4-Hourly chart, XRP/USD appears to be in a period of consolidation and may be forming a continuation pattern. A break to new highs and trend continuation could target the 4.10 region. However, a break below support at 2.50 would open the way to a test of 50MA at 2.10 and then 1.60.

XRPUSD 4-Hour Chart

Latest comments

Risk Disclosure: Trading in financial instruments and/or cryptocurrencies involves high risks including the risk of losing some, or all, of your investment amount, and may not be suitable for all investors. Prices of cryptocurrencies are extremely volatile and may be affected by external factors such as financial, regulatory or political events. Trading on margin increases the financial risks.
Before deciding to trade in financial instrument or cryptocurrencies you should be fully informed of the risks and costs associated with trading the financial markets, carefully consider your investment objectives, level of experience, and risk appetite, and seek professional advice where needed.
Fusion Media would like to remind you that the data contained in this website is not necessarily real-time nor accurate. The data and prices on the website are not necessarily provided by any market or exchange, but may be provided by market makers, and so prices may not be accurate and may differ from the actual price at any given market, meaning prices are indicative and not appropriate for trading purposes. Fusion Media and any provider of the data contained in this website will not accept liability for any loss or damage as a result of your trading, or your reliance on the information contained within this website.
It is prohibited to use, store, reproduce, display, modify, transmit or distribute the data contained in this website without the explicit prior written permission of Fusion Media and/or the data provider. All intellectual property rights are reserved by the providers and/or the exchange providing the data contained in this website.
Fusion Media may be compensated by the advertisers that appear on the website, based on your interaction with the advertisements or advertisers.
© 2007-2024 - Fusion Media Limited. All Rights Reserved.