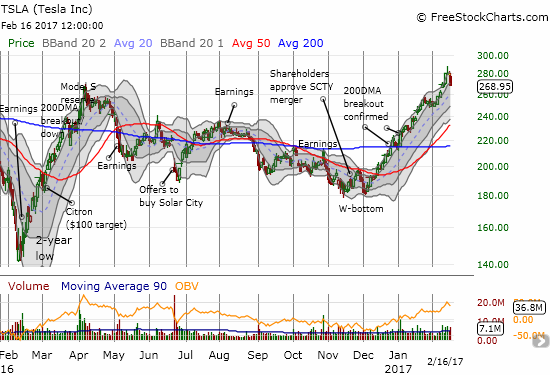
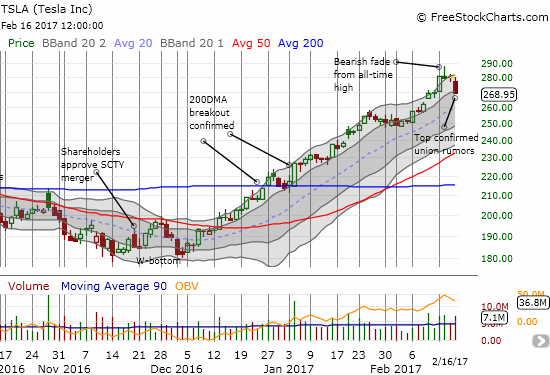
In early January, Tesla Motors (NASDAQ:TSLA) confirmed its breakout from resistance at its 200-day moving average (DMA). At that point, I got bullish on the stock from a swing trading perspective. That bullishness came to a screeching halt on Thursday.
On September 4, 2014, Tesla Motors (TSLA) reached an all-time closing high of $286.04/share. The stock has travelled on a roller coaster ride since then on its way to this long overdue challenge of that all-time high.

Since 2016, two sharp and extremely bullish rallies have provided bookends for an extended period of lackluster performance.
On February 14, 2017, TSLA stretched out its uptrend and rally well above its upper-Bollinger Band (BB) on its way to breaking through the all-time closing high. When buyers gave way to sellers, the fade created the potential for a bearish evening star pattern characteristic of tops. In this case, buyers stretched TSLA as far as it could go before exhausting themselves. News of efforts by the United Auto Workers (UAW) to start a union at TSLA provided the catalyst to embolden sellers enough to confirm the topping pattern. TSLA closed at its first lower low since the fade from the all-time high.

TSLA challenged its all-time closing high, but buyers were not able to sustain the pressure. Sellers faded TSLA and now a high-volume down day has confirmed a bearish topping pattern.
The toppiness as not quite driven an end to TSLA’s primary uptrend. TSLA closed right at the bottom of the upward trending channel formed by its upper-BBs. TSLA’s 20 and 50DMAs are barreling higher with strong uptrends. If sellers are able to continue the pressure from here, I fully expect those uptrend lines to provide tough resistance to further losses. Short interest provides an interesting backstory. Almost 40% of TSLA’s float is sold short. Any downward momentum will surely get punctuated by sharp rallies as many (new) shorts scramble to cover to get out the way of the latest Elon Musk tweet or other bullish news alert.
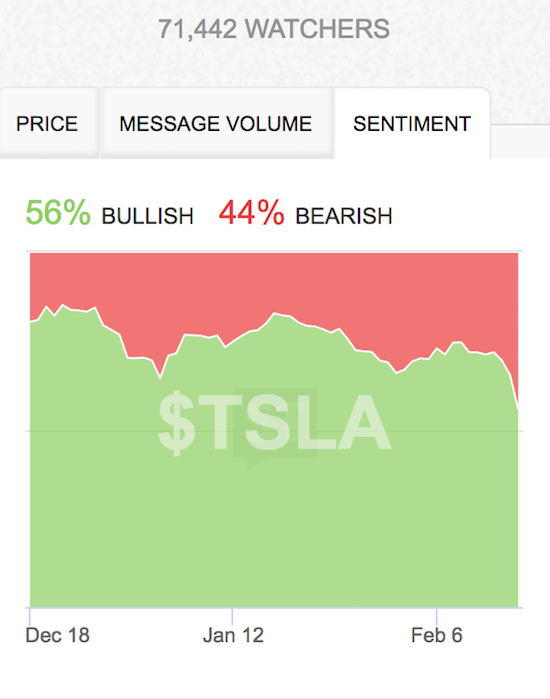
Sagging sentiment supports the prospect of an extended pullback for TSLA. StockTwits traders are only 55% bullish on TSLA versus 71% bullish last week.

StockTwits sentiment on TSLA is sagging and at its lowest point in at least 2 months.
I am playing this turn of events first as a hedged trade: a small short position covered by long call options. The stop for the short position is a closing all-time high. Otherwise, I will likely try to hold until at least a retest of 50DMA support. I will not renew the call option hedge after it expires in another day.
(On a side note, it is interesting to note how TSLA printed its W-bottom right around the point that notorious short-seller Citron slapped a $100 price target of TSLA back in March, 2016).
Be careful out there!
Full disclosure: short TSLA, long TSLA call options
