
The utility sector is a little bit different compared to the other sectors on the capital market. There is a huge need for capital when utilities think about expansion but they also deliver solid sales and returns. It’s like an infrastructure investment within the economy. I will apply my criteria about stocks with high potential to boost dividend payments to the utility sector.
Dividend Payout Ratio below 50 percent
Debt-To-Equity Ratio under 1
Only ten utilities fulfilled these criteria of which six are currently recommended to buy. IdaCorp is the top yielding pick on the list.
IDACORP (IDA) has a market capitalization of $2.42 billion. The company employs 2,067 people, generates revenue of $1.080 billion and has a net income of $168.93 million. IDACORP’s earnings before interest, taxes, depreciation and amortization (EBITDA) amounts to $366.54 million. The EBITDA margin is 33.92 percent (the operating margin is 22.45 percent and the net profit margin 15.63 percent).
Financial Analysis: The total debt represents 30.22 percent of IDACORP’s assets and the total debt in relation to the equity amounts to 91.39 percent. Due to the financial situation, a return on equity of 9.88 percent was realized by IDACORP. Twelve trailing months earnings per share reached a value of $3.75. Last fiscal year, IDACORP paid $1.37 in the form of dividends to shareholders.
Market Valuation: Here are the price ratios of the company: The P/E ratio is 12.85, the P/S ratio is 2.24 and the P/B ratio is finally 1.37. The dividend yield amounts to 3.57 percent and the beta ratio has a value of 0.45.
Transportadora de Gas Del Sur (TGS) has a market capitalization of $343.22 million. The company employs 829 people, generates revenue of $443.04 million and has a net income of $41.16 million. Transportadora de Gas Del Sur’s earnings before interest, taxes, depreciation and amortization (EBITDA) amounts to $161.79 million. The EBITDA margin is 36.52 percent (the operating margin is 27.41 percent and the net profit margin 9.29 percent).
Financial Analysis: The total debt represents 33.71 percent of Transportadora de Gas Del Sur’s assets and the total debt in relation to the equity amounts to 91.84 percent. Due to the financial situation, a return on equity of 11.97 percent was realized by Transportadora de Gas Del Sur. Twelve trailing months earnings per share reached a value of $0.29. Last fiscal year, Transportadora de Gas Del Sur paid $0.00 in the form of dividends to shareholders.
Market Valuation: Here are the price ratios of the company: The P/E ratio is 7.32, the P/S ratio is 0.59 and the P/B ratio is finally 0.98. The dividend yield amounts to 15.39 percent and the beta ratio has a value of 0.63.
Chesapeake Utilities Corporation (CPK) has a market capitalization of $488.48 million. The company employs 738 people, generates revenue of $392.50 million and has a net income of $28.86 million. Chesapeake Utilities Corporation’s earnings before interest, taxes, depreciation and amortization (EBITDA) amounts to $79.14 million. The EBITDA margin is 20.16 percent (the operating margin is 14.43 percent and the net profit margin 7.35 percent).
Financial Analysis: The total debt represents 23.35 percent of Chesapeake Utilities Corporation’s assets and the total debt in relation to the equity amounts to 66.76 percent. Due to the financial situation, a return on equity of 11.61 percent was realized by Chesapeake Utilities Corporation. Twelve trailing months earnings per share reached a value of $3.34. Last fiscal year, Chesapeake Utilities Corporation paid $1.44 in the form of dividends to shareholders.
Market Valuation: Here are the price ratios of the company: The P/E ratio is 15.17, the P/S ratio is 1.24 and the P/B ratio is finally 1.90. The dividend yield amounts to 3.03 percent and the beta ratio has a value of 0.47.
Take a closer look at the full list of utilities with potential to boost dividends. The average P/E ratio amounts to 16.98 and forward P/E ratio is 16.41. The dividend yield has a value of 2.41 percent. Price to book ratio is 1.95 and price to sales ratio 2.38. The operating margin amounts to 22.63 percent and the beta ratio is 1.95. Stocks from the list have an average debt to equity ratio of 0.70.
Here is the full table with some fundamentals (TTM): 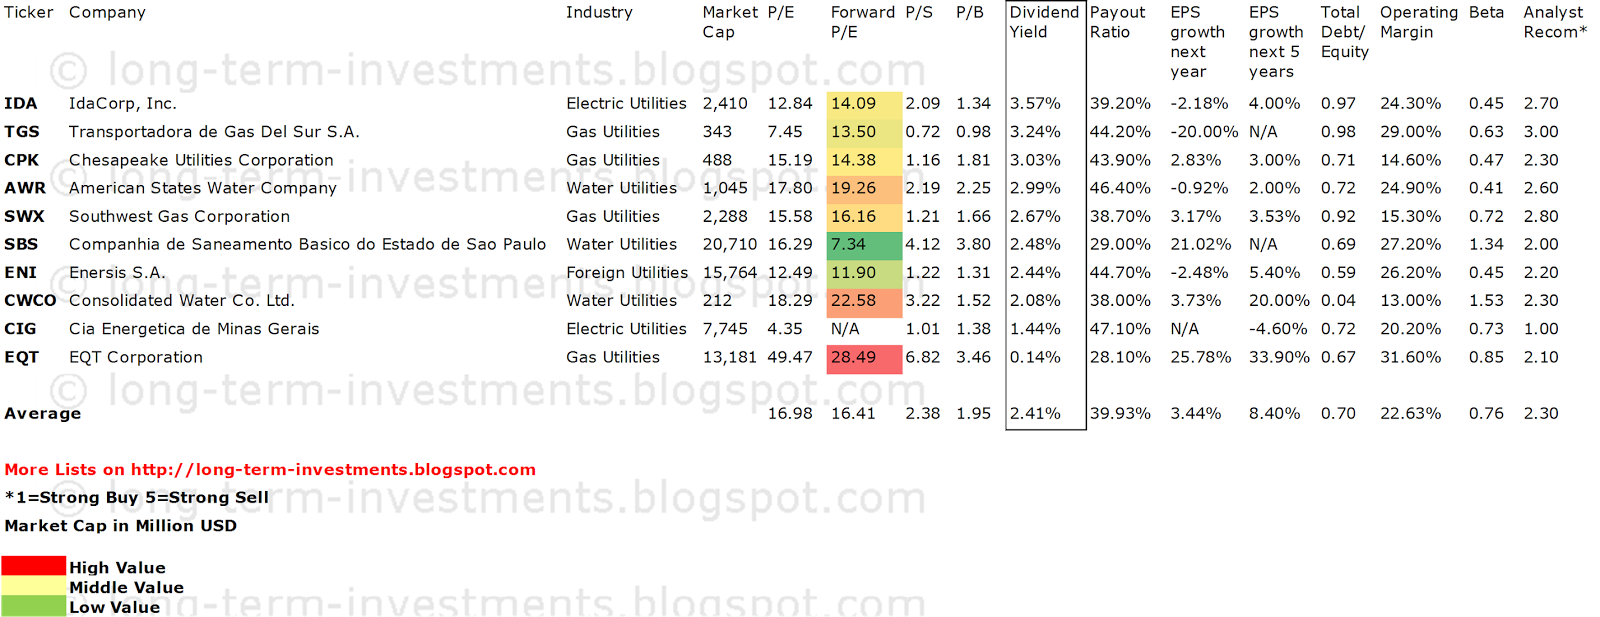
Related Stock Ticker Symbols:
IDA, TGS, CPK, AWR, SWX, SBS, ENI, CWCO, CIG, EQT
Disclosure: I have no positions in any stocks mentioned, and no plans to initiate any positions within the next 72 hours. I receive no compensation to write about any specific stock, sector or theme.
- English (UK)
- English (India)
- English (Canada)
- English (Australia)
- English (South Africa)
- English (Philippines)
- English (Nigeria)
- Deutsch
- Español (España)
- Español (México)
- Français
- Italiano
- Nederlands
- Português (Portugal)
- Polski
- Português (Brasil)
- Русский
- Türkçe
- العربية
- Ελληνικά
- Svenska
- Suomi
- עברית
- 日本語
- 한국어
- 简体中文
- 繁體中文
- Bahasa Indonesia
- Bahasa Melayu
- ไทย
- Tiếng Việt
- हिंदी
Top Utilities With Solid Debt And Payout Figures
Published 10/07/2013, 05:32 AM
Updated 07/09/2023, 06:31 AM
Top Utilities With Solid Debt And Payout Figures
")
3rd party Ad. Not an offer or recommendation by Investing.com. See disclosure here or
remove ads
.
Latest comments
Install Our App
Risk Disclosure: Trading in financial instruments and/or cryptocurrencies involves high risks including the risk of losing some, or all, of your investment amount, and may not be suitable for all investors. Prices of cryptocurrencies are extremely volatile and may be affected by external factors such as financial, regulatory or political events. Trading on margin increases the financial risks.
Before deciding to trade in financial instrument or cryptocurrencies you should be fully informed of the risks and costs associated with trading the financial markets, carefully consider your investment objectives, level of experience, and risk appetite, and seek professional advice where needed.
Fusion Media would like to remind you that the data contained in this website is not necessarily real-time nor accurate. The data and prices on the website are not necessarily provided by any market or exchange, but may be provided by market makers, and so prices may not be accurate and may differ from the actual price at any given market, meaning prices are indicative and not appropriate for trading purposes. Fusion Media and any provider of the data contained in this website will not accept liability for any loss or damage as a result of your trading, or your reliance on the information contained within this website.
It is prohibited to use, store, reproduce, display, modify, transmit or distribute the data contained in this website without the explicit prior written permission of Fusion Media and/or the data provider. All intellectual property rights are reserved by the providers and/or the exchange providing the data contained in this website.
Fusion Media may be compensated by the advertisers that appear on the website, based on your interaction with the advertisements or advertisers.
© 2007-2024 - Fusion Media Limited. All Rights Reserved.