Here are the Rest of the Top 10:
Blackstone Group, Ticker: NYSE:BX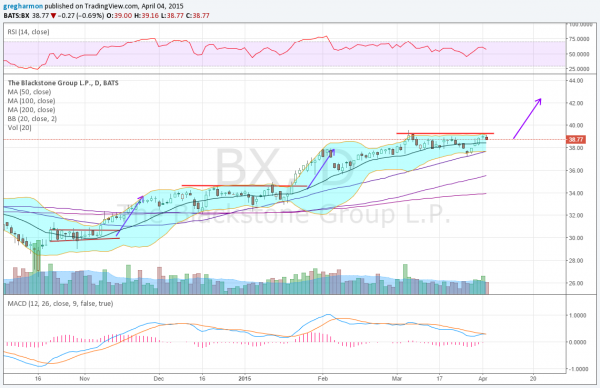
Blackstone Group, BX, has been rising since the October low. It gave a chance for an entry in late January as it broke consolidation and may be giving another chance now. The RSI is in the bullish zone while the MACD is about to cross up. The Bollinger Bands® have also squeezed, often a precursor to a move. There is resistance at 39.25 and then free air above. Support lower comes at 37.90 and 37.15. Short interest is low under 3%. Enter long on a move over 39.25 with a stop at 37.90. As it moves over 40 move the stop to break even, and then to a $1 trailing stop over 40.25. Take off 1/3 on a stall at 42.50 or higher. As an options trade consider the April 39 Calls (offered at 67 cents late Thursday) and trade them like the stock trade (using the stock price as a trigger, stop and target). Add some leverage by selling the April 37 Puts (23 cents). The company reports before the open April 16th.
Cognex, Ticker: NASDAQ:CGNX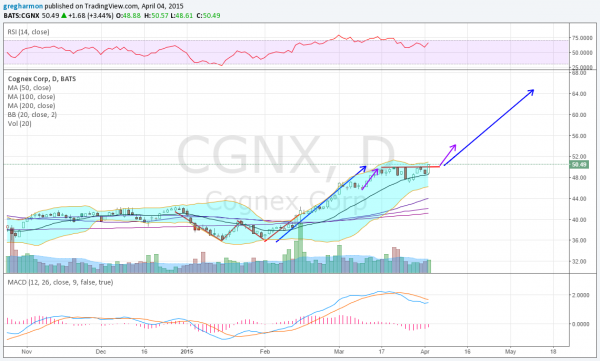
Cognex, CGNX, went through a ‘W’ like consolidation before moving higher. Now it is consolidating and perhaps peeking over resistance. The RSI is bullish and rising with the MACD leveling after a pullback. There is an upward drift in the Bollinger Bands as it moves higher and a small Measured Move to 54.35 and then 64.60. There is no resistance higher but support may come at 48.20 and 47 followed by 45.80. Short interest is moderate at 3.8%. Enter long now (over 50) with a stop at 48.20. As it moves over 51.25 move the stop to break even and then to a $1.50 trailing stop over 51.50. Take off 1/3 on a stall at 64.60 or higher. As an options trade consider the April 50 Calls ($1.50) and trade them like the stock trade.
NVE, Ticker: NASDAQ:NVEC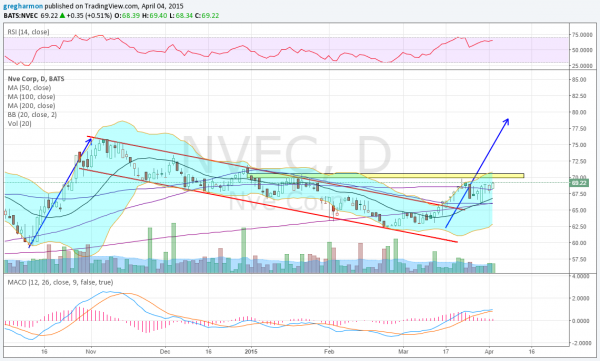
NVE, NVEC, went through a downward consolidating channel, that ended when it touched the 200 day SMA. Since that touch it has risen and is consolidating at the late December high. The RSI is rising and bullish and the MACD is also rising, supporting more upside. The full Measured Move higher would target 79. There is resistance at 69.25 and 70 followed by 70.65 and 71.70 before 73 and 75.75. Support lower comes at 67.65 and 66.20 followed by 62.90. Short interest is low at 2%. Enter long on a move over 69.25 (or more conservatively over 70.65) with a stop at 67.50. As it moves over 70.65 move the stop to break even and then to a $2.00 trailing stop over 71.25. Take off 1/3 on a stall at 79 or higher. There are no options for this stock.
Och-Ziff Capital Management, Ticker: NYSE:OZM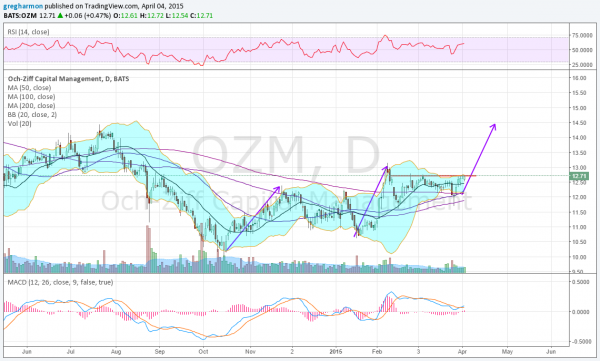
Och-Ziff Capital Management, OZM, completed a Measured Move higher in early February and has been consolidating since then. Heading into the week the move higher off of the Hammer at the 50 day SMA has support for more upside from a rising RSI and a MACD about to cross up. There is resistance at 12.75 and then 13 followed by 14 and 14.20. Support lower comes at 12.30 and 12 followed by 16.65. Short interest is low at 1.7%. Enter long on a move over 12.75 with a stop at 12.30. As it moves over 13 move the stop to break even and then to a 35 cent trailing stop over 13.10. Take off 1/3 on a stall at 14.20 or higher and by the Measured Move at 14.50. As an options trade consider the May 12.5 Calls (60 cents).
Whirlpool, Ticker: NYSE:WHR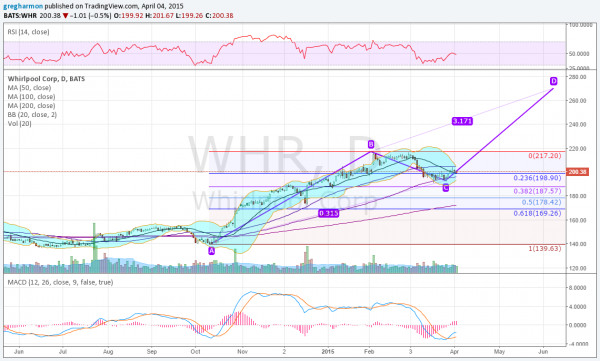
Whirlpool, WHR, had a great run higher from the low in October to a high in February. Now it has pulled back and is consolidating over the 100 day SMA. Last week saw it move over consolidation and it is currently holding there. The RSI is stalling at the mid line but the MACD is crossed and rising as the Bollinger Bands® squeeze. The 23.6% retracement has held reign as the Bollinger Bands are squeezing. There is resistance higher at 205.40 and 210 followed by 214.40 and 217.10. Above that triggers an AB=CD target of 271. Support lower comes at 198.80 and 193.40 followed by 187.25. Short interest is low at 2.1%. Enter long on a move over 204 with a stop at 198.50. As it moves over 207 move the stop to break even, and then to a $5 trailing stop over 209. Take off 1/3 on a stall at 217.10 or higher and by 271 :-). As an options trade consider the April 200 Calls ($4.15) and trade them like the stock trade. Offset some cost by selling the April 201 Calls (71 cents) and or the April 190 Puts (73 cents). Give it more time with a May 190/200 bullish Risk Reversal ($4.35).
Up Next: Bonus Idea
After reviewing over 1,000 charts, I have found some good setups for the week. These were selected and should be viewed in the context of the broad Market Macro picture reviewed Thursday which, heading into the first week of April the Equity markets are mixed with the IWM strong but the SPY and QQQ weaker and maybe ready for some short term downside.
Elsewhere look for Gold to bounce around 1200 as it consolidates while Crude Oil churns back in its consolidation channel. The US Dollar Index should generally move sideways but with an upward bias while US Treasuries are biased lower short term in their consolidation. The Shanghai Composite looks very strong and iShares MSCI Emerging Markets (ARCA:EEM) are getting jealous, and trying to join it to the upside.
Volatility looks to remain subdued keeping the bias higher for the equity index ETF’s ARCA:SPY, ARCA:IWM and NASDAQ:QQQ. Their charts point to consolidation or even a downside bias for the SPY and QQQ, while the IWM seem the place to be, holding up well at the all-time highs. Use this information as you prepare for the coming week and trad’em well.
DISCLAIMER: The information in this blog post represents my own opinions and does not contain a recommendation for any particular security or investment. I or my affiliates may hold positions or other interests in securities mentioned in the Blog, please see my Disclaimer page for my full disclaimer.
